| Red | Green | Blue | |
| z | 17.64 | ||
| znorm | Inf | ||
| sky | -Inf | -Inf | -NaN |
| S/N | 31.2 | 53.8 | 66.8 |
| S/N(c) | 0.0 | 0.0 | 0.0 |
| SN(E/C) |
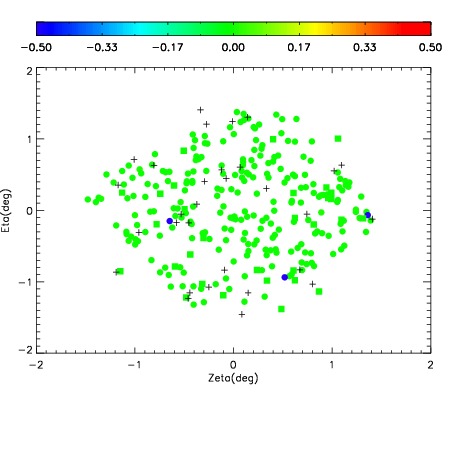
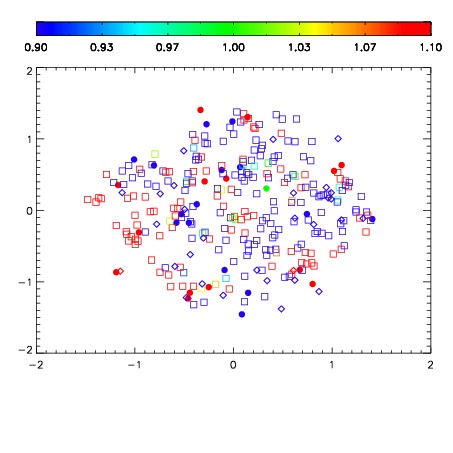
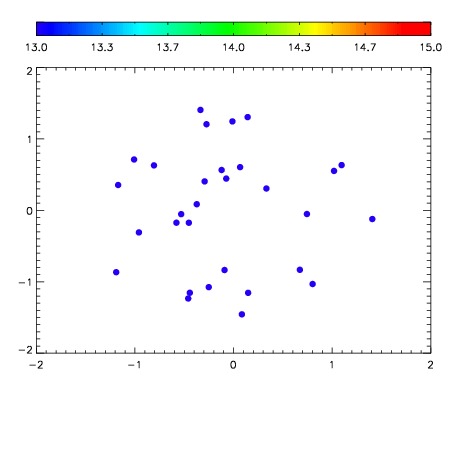

| Frame | Nreads | Zeropoints | Mag plots | Spatial mag deviation | Spatial sky 16325A emission deviations (filled: sky, open: star) | Spatial sky continuum emission | Spatial sky telluric CO2 absorption deviations (filled: H < 10) | |||||||||||||||||||||||
| 0 | 0 |
|
|
|
|
|
|
| IPAIR | NAME | SHIFT | NEWSHIFT | S/N | NAME | SHIFT | NEWSHIFT | S/N |
| 0 | 17320035 | 0.513421 | 0.00000 | 19.1667 | 17320040 | 0.000431803 | 0.512989 | 19.1338 |
| 1 | 17320038 | 0.511923 | 0.00149798 | 19.2304 | 17320037 | 0.00218575 | 0.511235 | 19.2475 |
| 2 | 17320039 | 0.511379 | 0.00204200 | 19.2019 | 17320033 | 0.00000 | 0.513421 | 19.2422 |
| 3 | 17320034 | 0.512786 | 0.000635028 | 19.1894 | 17320036 | 0.00281069 | 0.510610 | 19.1841 |
| 4 | 17320042 | 0.509872 | 0.00354898 | 19.0787 | 17320041 | -0.000148569 | 0.513570 | 19.0822 |