| Red | Green | Blue | |
| z | 17.64 | ||
| znorm | Inf | ||
| sky | -Inf | -Inf | -Inf |
| S/N | 23.8 | 39.5 | 48.2 |
| S/N(c) | 0.0 | 0.0 | 0.0 |
| SN(E/C) |
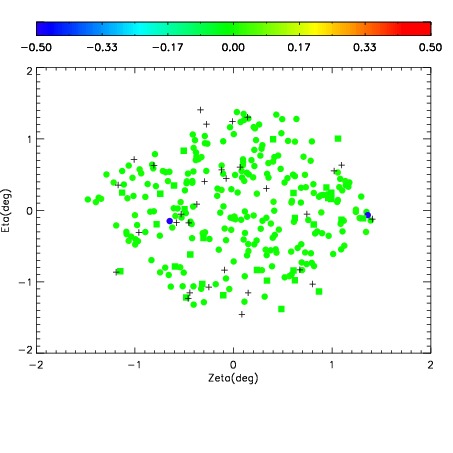
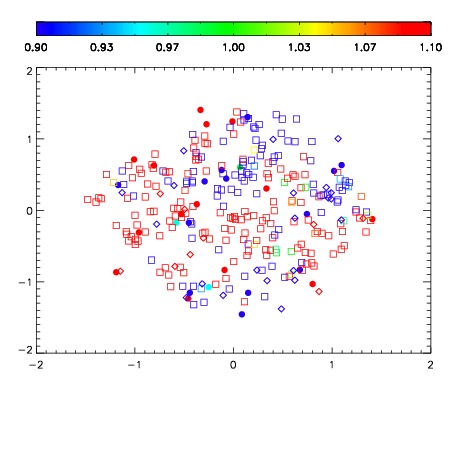


| Frame | Nreads | Zeropoints | Mag plots | Spatial mag deviation | Spatial sky 16325A emission deviations (filled: sky, open: star) | Spatial sky continuum emission | Spatial sky telluric CO2 absorption deviations (filled: H < 10) | |||||||||||||||||||||||
| 0 | 0 |
|
|
|
|
|
|
| IPAIR | NAME | SHIFT | NEWSHIFT | S/N | NAME | SHIFT | NEWSHIFT | S/N |
| 0 | 17570029 | 0.000821278 | 0.00000 | 18.3174 | 17570031 | -0.507932 | 0.508753 | 18.6782 |
| 1 | 17570025 | 0.00000 | 0.000821278 | 19.1268 | 17570026 | -0.505315 | 0.506136 | 19.0501 |
| 2 | 17570032 | 0.000781501 | 3.97770e-05 | 18.9047 | 17570030 | -0.507394 | 0.508215 | 18.7980 |
| 3 | 17570028 | 0.000379881 | 0.000441397 | 18.8076 | 17570027 | -0.505097 | 0.505918 | 18.7786 |