| Red | Green | Blue | |
| z | 17.64 | ||
| znorm | Inf | ||
| sky | -Inf | -Inf | -NaN |
| S/N | 32.4 | 55.6 | 61.7 |
| S/N(c) | 0.0 | 0.0 | 0.0 |
| SN(E/C) |
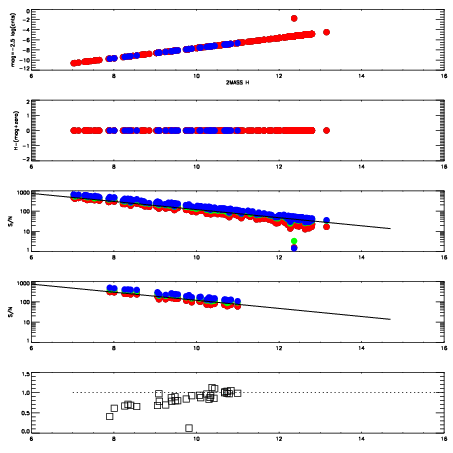
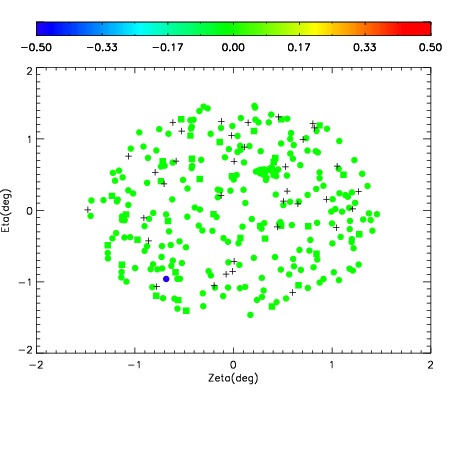

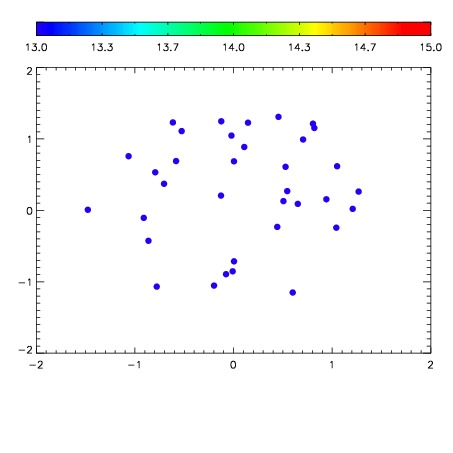

| Frame | Nreads | Zeropoints | Mag plots | Spatial mag deviation | Spatial sky 16325A emission deviations (filled: sky, open: star) | Spatial sky continuum emission | Spatial sky telluric CO2 absorption deviations (filled: H < 10) | |||||||||||||||||||||||
| 0 | 0 |
|
|
|
|
|
|
| IPAIR | NAME | SHIFT | NEWSHIFT | S/N | NAME | SHIFT | NEWSHIFT | S/N |
| 0 | 13480055 | 0.500559 | 0.00000 | 19.2542 | 13480054 | 0.00000 | 0.500559 | 19.2319 |
| 1 | 13480056 | 0.499887 | 0.000671983 | 19.2621 | 13480057 | -0.000972206 | 0.501531 | 19.2598 |
| 2 | 13480059 | 0.496043 | 0.00451598 | 19.2200 | 13480058 | -0.00116165 | 0.501721 | 19.2165 |
| 3 | 13480060 | 0.495997 | 0.00456196 | 19.2188 | 13480061 | -0.00257613 | 0.503135 | 19.1998 |