| Red | Green | Blue | |
| z | 17.64 | ||
| znorm | Inf | ||
| sky | -Inf | -Inf | -NaN |
| S/N | 27.4 | 47.0 | 53.7 |
| S/N(c) | 0.0 | 0.0 | 0.0 |
| SN(E/C) |
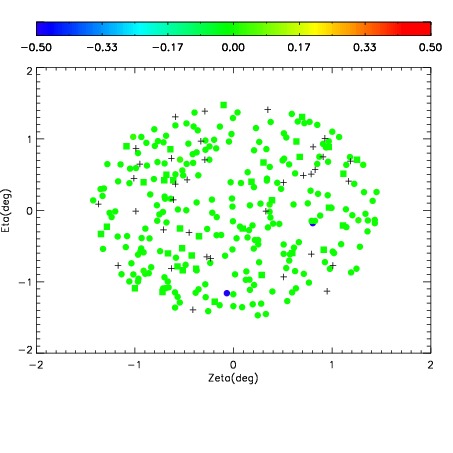
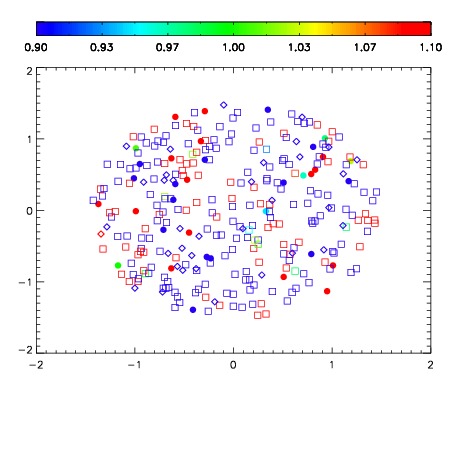
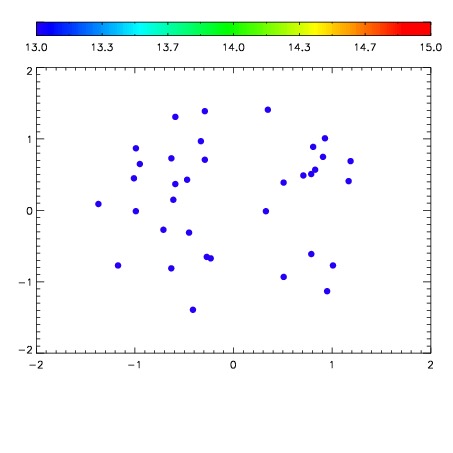

| Frame | Nreads | Zeropoints | Mag plots | Spatial mag deviation | Spatial sky 16325A emission deviations (filled: sky, open: star) | Spatial sky continuum emission | Spatial sky telluric CO2 absorption deviations (filled: H < 10) | |||||||||||||||||||||||
| 0 | 0 |
|
|
|
|
|
|
| IPAIR | NAME | SHIFT | NEWSHIFT | S/N | NAME | SHIFT | NEWSHIFT | S/N |
| 0 | 13830026 | 0.502767 | 0.00000 | 19.1950 | 13830028 | -5.82641e-05 | 0.502825 | 19.1606 |
| 1 | 13830022 | 0.500448 | 0.00231904 | 19.1711 | 13830021 | 0.00000 | 0.502767 | 19.1528 |
| 2 | 13830023 | 0.500791 | 0.00197601 | 19.1592 | 13830025 | 0.00150565 | 0.501261 | 19.1430 |
| 3 | 13830027 | 0.502642 | 0.000125051 | 19.1326 | 13830024 | 0.00102515 | 0.501742 | 19.0623 |