| Red | Green | Blue | |
| z | 17.64 | ||
| znorm | Inf | ||
| sky | -Inf | -Inf | -Inf |
| S/N | 20.1 | 35.9 | 39.4 |
| S/N(c) | 0.0 | 0.0 | 0.0 |
| SN(E/C) |
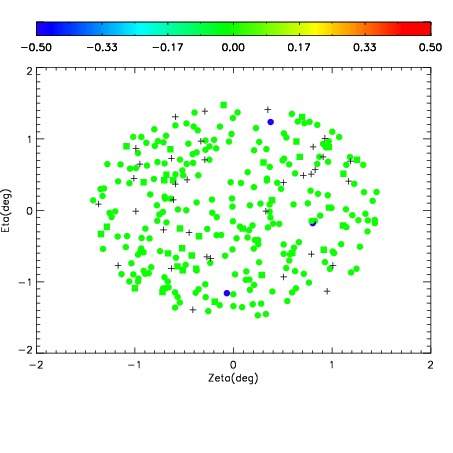
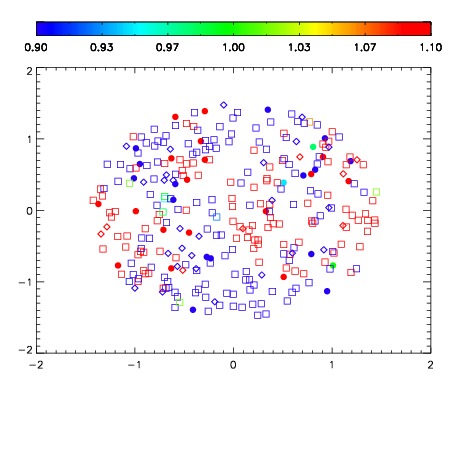


| Frame | Nreads | Zeropoints | Mag plots | Spatial mag deviation | Spatial sky 16325A emission deviations (filled: sky, open: star) | Spatial sky continuum emission | Spatial sky telluric CO2 absorption deviations (filled: H < 10) | |||||||||||||||||||||||
| 0 | 0 |
|
|
|
|
|
|
| IPAIR | NAME | SHIFT | NEWSHIFT | S/N | NAME | SHIFT | NEWSHIFT | S/N |
| 0 | 14600016 | 0.499283 | 0.00000 | 18.8617 | 14600017 | 0.00187617 | 0.497407 | 18.7974 |
| 1 | 14600015 | 0.499031 | 0.000251979 | 18.7794 | 14600013 | 0.000893412 | 0.498390 | 18.6111 |
| 2 | 14600012 | 0.498668 | 0.000615001 | 18.7172 | 14600014 | 0.00128820 | 0.497995 | 18.5782 |
| 3 | 14600011 | 0.497627 | 0.00165600 | 18.6578 | 14600010 | 0.00000 | 0.499283 | 18.5602 |