| Red | Green | Blue | |
| z | 17.64 | ||
| znorm | Inf | ||
| sky | -NaN | -Inf | -NaN |
| S/N | 23.5 | 40.0 | 45.1 |
| S/N(c) | 0.0 | 0.0 | 0.0 |
| SN(E/C) |
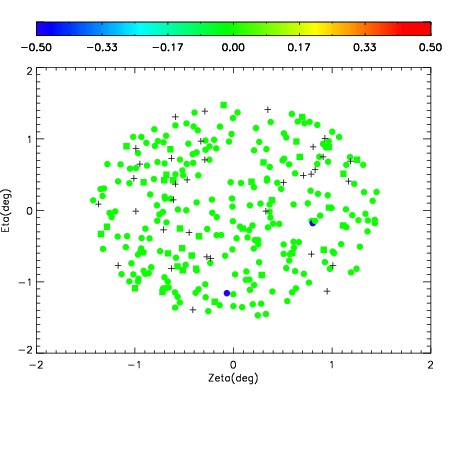
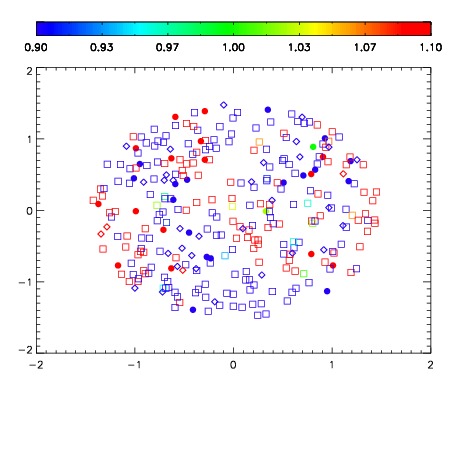


| Frame | Nreads | Zeropoints | Mag plots | Spatial mag deviation | Spatial sky 16325A emission deviations (filled: sky, open: star) | Spatial sky continuum emission | Spatial sky telluric CO2 absorption deviations (filled: H < 10) | |||||||||||||||||||||||
| 0 | 0 |
|
|
|
|
|
|
| IPAIR | NAME | SHIFT | NEWSHIFT | S/N | NAME | SHIFT | NEWSHIFT | S/N |
| 0 | 14670016 | 0.501387 | 0.00000 | 18.7669 | 14670015 | 0.000299761 | 0.501087 | 18.7380 |
| 1 | 14670012 | 0.497878 | 0.00350901 | 18.9165 | 14670011 | 0.00000 | 0.501387 | 18.9401 |
| 2 | 14670013 | 0.498824 | 0.00256300 | 18.8361 | 14670014 | 4.56610e-05 | 0.501341 | 18.8628 |
| 3 | 14670017 | 0.501374 | 1.29938e-05 | 18.8070 | 14670018 | 0.000588500 | 0.500799 | 18.7835 |