| Red | Green | Blue | |
| z | 17.64 | ||
| znorm | Inf | ||
| sky | -Inf | -Inf | -NaN |
| S/N | 27.4 | 47.4 | 52.4 |
| S/N(c) | 0.0 | 0.0 | 0.0 |
| SN(E/C) |
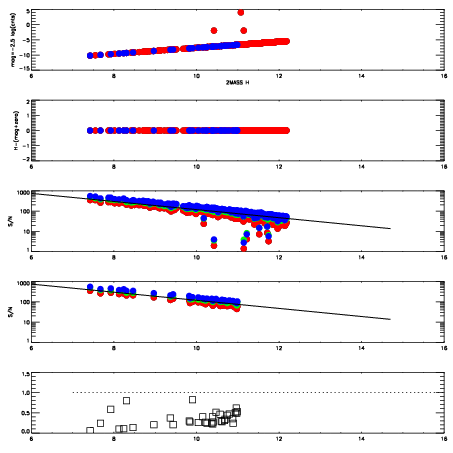
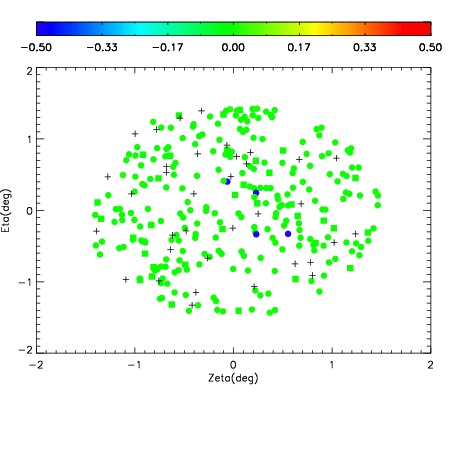
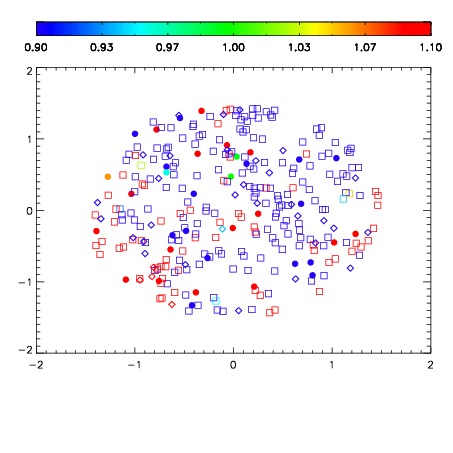
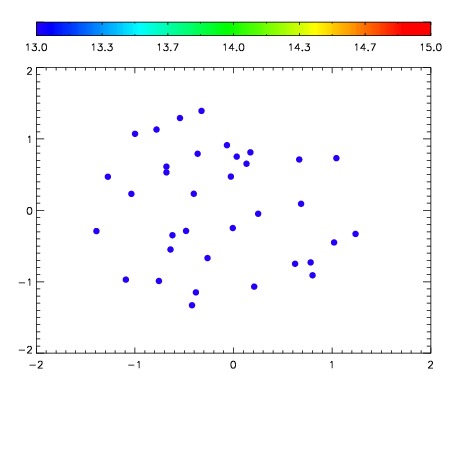

| Frame | Nreads | Zeropoints | Mag plots | Spatial mag deviation | Spatial sky 16325A emission deviations (filled: sky, open: star) | Spatial sky continuum emission | Spatial sky telluric CO2 absorption deviations (filled: H < 10) | |||||||||||||||||||||||
| 0 | 0 |
|
|
|
|
|
|
| IPAIR | NAME | SHIFT | NEWSHIFT | S/N | NAME | SHIFT | NEWSHIFT | S/N |
| 0 | 14650028 | 0.494138 | 0.00000 | 19.0970 | 14650029 | 0.00162584 | 0.492512 | 19.0966 |
| 1 | 14650027 | 0.493833 | 0.000304997 | 19.1166 | 14650026 | 0.00132790 | 0.492810 | 19.1121 |
| 2 | 14650023 | 0.492566 | 0.00157201 | 19.0457 | 14650025 | 0.000276607 | 0.493861 | 19.0824 |
| 3 | 14650024 | 0.493217 | 0.000921011 | 18.9800 | 14650022 | 0.00000 | 0.494138 | 19.0324 |