| Red | Green | Blue | |
| z | 17.64 | ||
| znorm | Inf | ||
| sky | -Inf | -Inf | -NaN |
| S/N | 17.8 | 32.6 | 37.8 |
| S/N(c) | 0.0 | 0.0 | 0.0 |
| SN(E/C) |
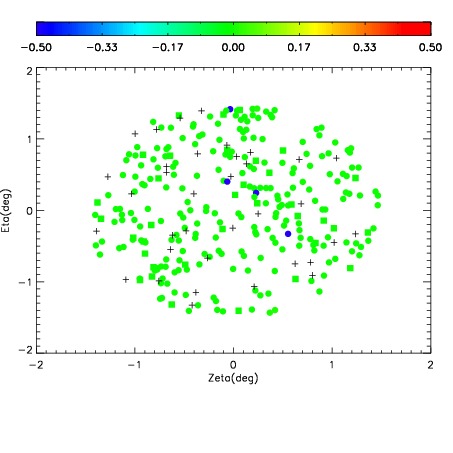
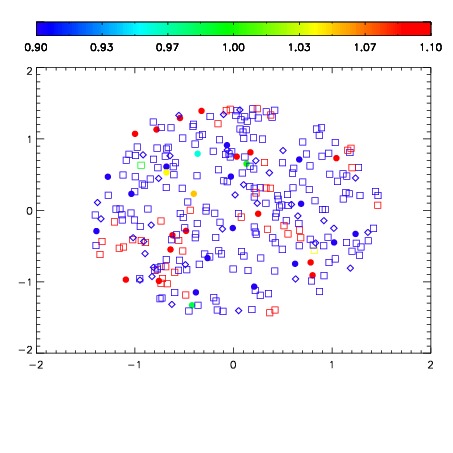
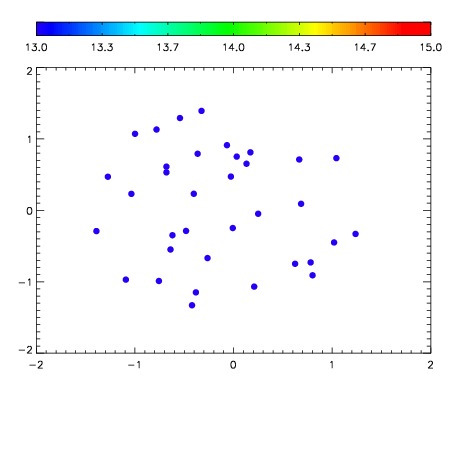

| Frame | Nreads | Zeropoints | Mag plots | Spatial mag deviation | Spatial sky 16325A emission deviations (filled: sky, open: star) | Spatial sky continuum emission | Spatial sky telluric CO2 absorption deviations (filled: H < 10) | |||||||||||||||||||||||
| 0 | 0 |
|
|
|
|
|
|
| IPAIR | NAME | SHIFT | NEWSHIFT | S/N | NAME | SHIFT | NEWSHIFT | S/N |
| 0 | 17000035 | 0.488699 | 0.00000 | 15.8462 | 17000036 | 0.00221688 | 0.486482 | 16.9367 |
| 1 | 17000039 | 0.487337 | 0.00136200 | 19.0051 | 17000040 | 0.00250074 | 0.486198 | 19.1400 |
| 2 | 17000038 | 0.487762 | 0.000936985 | 18.5315 | 17000037 | 0.000833156 | 0.487866 | 18.7952 |
| 3 | 17000034 | 0.488050 | 0.000648975 | 17.6030 | 17000033 | 0.00000 | 0.488699 | 18.1536 |