| Red | Green | Blue | |
| z | 17.64 | ||
| znorm | Inf | ||
| sky | -Inf | -Inf | -Inf |
| S/N | 23.3 | 39.9 | 46.2 |
| S/N(c) | 0.0 | 0.0 | 0.0 |
| SN(E/C) |
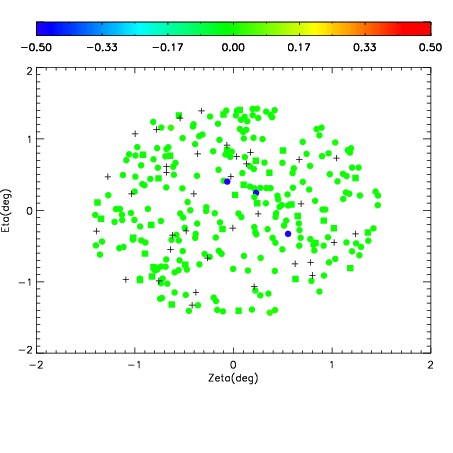
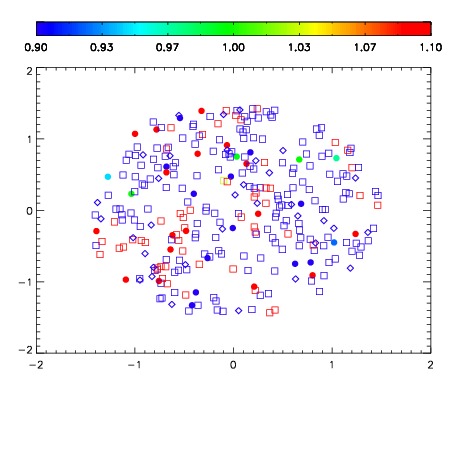
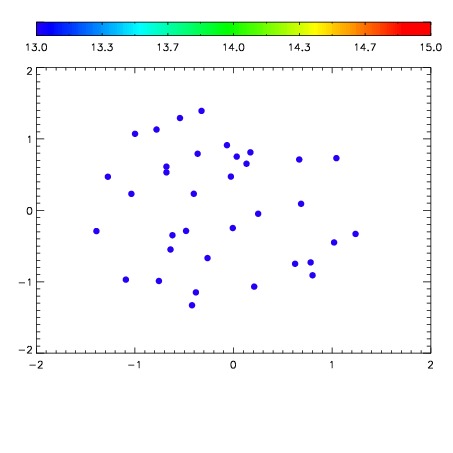

| Frame | Nreads | Zeropoints | Mag plots | Spatial mag deviation | Spatial sky 16325A emission deviations (filled: sky, open: star) | Spatial sky continuum emission | Spatial sky telluric CO2 absorption deviations (filled: H < 10) | |||||||||||||||||||||||
| 0 | 0 |
|
|
|
|
|
|
| IPAIR | NAME | SHIFT | NEWSHIFT | S/N | NAME | SHIFT | NEWSHIFT | S/N |
| 0 | 17030082 | 0.483670 | 0.00000 | 19.0611 | 17030081 | 0.00000 | 0.483670 | 18.9786 |
| 1 | 17030086 | 0.481654 | 0.00201601 | 19.0778 | 17030085 | -0.000700356 | 0.484370 | 19.0972 |
| 2 | 17030083 | 0.483550 | 0.000119984 | 19.0647 | 17030084 | 7.69930e-06 | 0.483662 | 19.0750 |