| Red | Green | Blue | |
| z | 17.64 | ||
| znorm | Inf | ||
| sky | -Inf | -Inf | -Inf |
| S/N | 17.1 | 32.5 | 35.0 |
| S/N(c) | 0.0 | 0.0 | 0.0 |
| SN(E/C) |
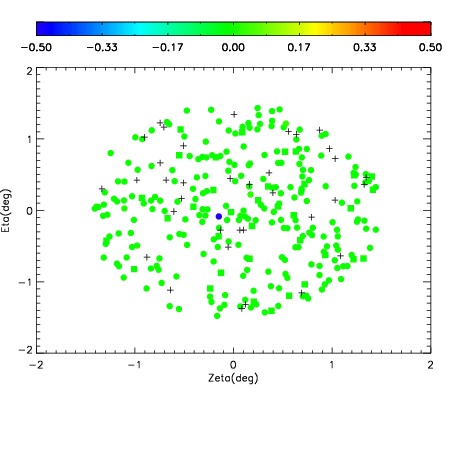
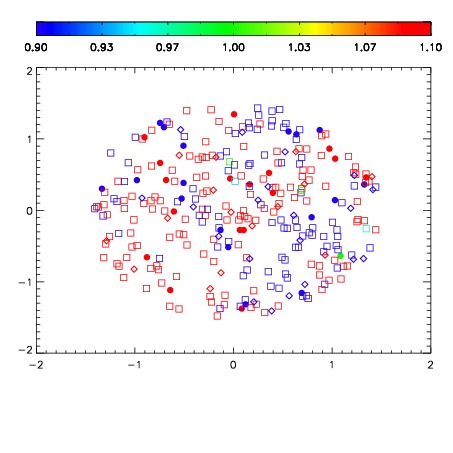
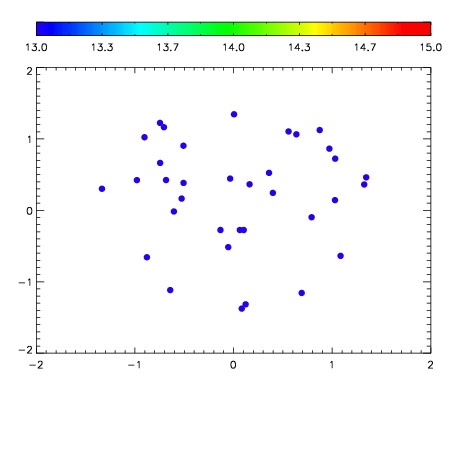

| Frame | Nreads | Zeropoints | Mag plots | Spatial mag deviation | Spatial sky 16325A emission deviations (filled: sky, open: star) | Spatial sky continuum emission | Spatial sky telluric CO2 absorption deviations (filled: H < 10) | |||||||||||||||||||||||
| 0 | 0 |
|
|
|
|
|
|
| IPAIR | NAME | SHIFT | NEWSHIFT | S/N | NAME | SHIFT | NEWSHIFT | S/N |
| 0 | 14600038 | 0.498562 | 0.00000 | 18.2835 | 14600040 | -0.000393107 | 0.498955 | 18.2574 |
| 1 | 14600042 | 0.498073 | 0.000488997 | 18.6057 | 14600036 | 0.00000 | 0.498562 | 18.8516 |
| 2 | 14600037 | 0.498208 | 0.000354022 | 18.5663 | 14600039 | 0.000415842 | 0.498146 | 18.5104 |
| 3 | 14600041 | 0.497006 | 0.00155601 | 18.3854 | 14600043 | 0.000655267 | 0.497907 | 18.3040 |