| Red | Green | Blue | |
| z | 17.64 | ||
| znorm | Inf | ||
| sky | -Inf | -Inf | -Inf |
| S/N | 17.8 | 31.2 | 34.3 |
| S/N(c) | 0.0 | 0.0 | 0.0 |
| SN(E/C) |
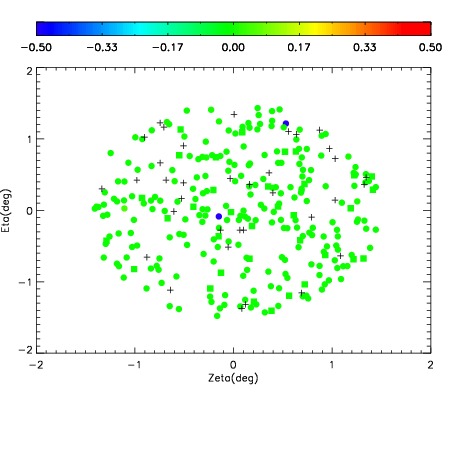
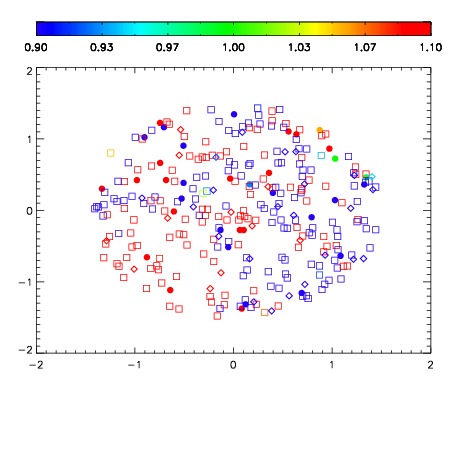


| Frame | Nreads | Zeropoints | Mag plots | Spatial mag deviation | Spatial sky 16325A emission deviations (filled: sky, open: star) | Spatial sky continuum emission | Spatial sky telluric CO2 absorption deviations (filled: H < 10) | |||||||||||||||||||||||
| 0 | 0 |
|
|
|
|
|
|
| IPAIR | NAME | SHIFT | NEWSHIFT | S/N | NAME | SHIFT | NEWSHIFT | S/N |
| 0 | 14940013 | 0.499247 | 0.00000 | 18.2348 | 14940014 | -0.00324066 | 0.502488 | 17.7219 |
| 1 | 14940012 | 0.499222 | 2.50041e-05 | 18.4884 | 14940018 | -0.00402296 | 0.503270 | 18.8998 |
| 2 | 14940017 | 0.497470 | 0.00177702 | 18.4792 | 14940011 | 0.00000 | 0.499247 | 18.8148 |
| 3 | 14940016 | 0.496446 | 0.00280100 | 17.8056 | 14940015 | -0.00349061 | 0.502738 | 17.6119 |