| Red | Green | Blue | |
| z | 17.64 | ||
| znorm | Inf | ||
| sky | -Inf | -Inf | -Inf |
| S/N | 24.2 | 42.0 | 46.6 |
| S/N(c) | 0.0 | 0.0 | 0.0 |
| SN(E/C) |

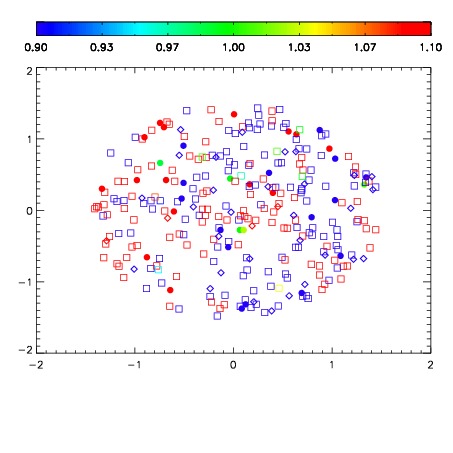


| Frame | Nreads | Zeropoints | Mag plots | Spatial mag deviation | Spatial sky 16325A emission deviations (filled: sky, open: star) | Spatial sky continuum emission | Spatial sky telluric CO2 absorption deviations (filled: H < 10) | |||||||||||||||||||||||
| 0 | 0 |
|
|
|
|
|
|
| IPAIR | NAME | SHIFT | NEWSHIFT | S/N | NAME | SHIFT | NEWSHIFT | S/N |
| 0 | 14970020 | 0.497009 | 0.00000 | 18.6861 | 14970021 | -0.000853686 | 0.497863 | 18.6480 |
| 1 | 14970015 | 0.496343 | 0.000666022 | 18.9722 | 14970014 | 0.00000 | 0.497009 | 18.9593 |
| 2 | 14970016 | 0.495870 | 0.00113901 | 18.9390 | 14970017 | -5.02389e-05 | 0.497059 | 18.9574 |
| 3 | 14970019 | 0.496739 | 0.000270009 | 18.8133 | 14970018 | 3.65010e-05 | 0.496973 | 18.9404 |