| Red | Green | Blue | |
| z | 17.64 | ||
| znorm | Inf | ||
| sky | -Inf | -Inf | -Inf |
| S/N | 24.7 | 41.8 | 50.0 |
| S/N(c) | 0.0 | 0.0 | 0.0 |
| SN(E/C) |
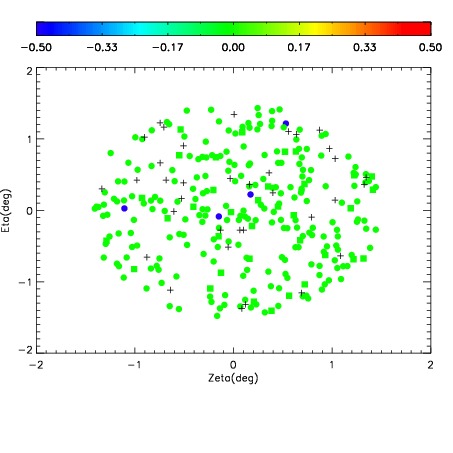
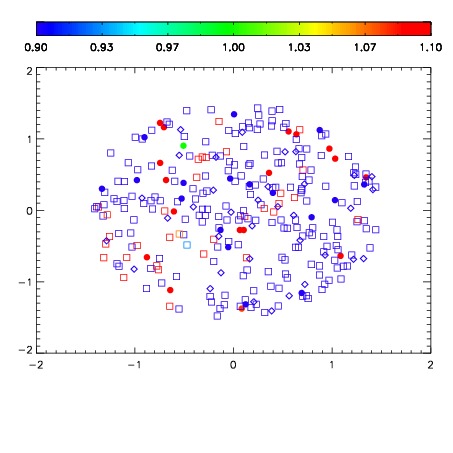
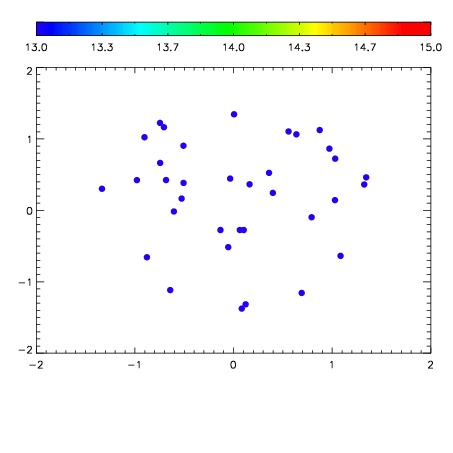

| Frame | Nreads | Zeropoints | Mag plots | Spatial mag deviation | Spatial sky 16325A emission deviations (filled: sky, open: star) | Spatial sky continuum emission | Spatial sky telluric CO2 absorption deviations (filled: H < 10) | |||||||||||||||||||||||
| 0 | 0 |
|
|
|
|
|
|
| IPAIR | NAME | SHIFT | NEWSHIFT | S/N | NAME | SHIFT | NEWSHIFT | S/N |
| 0 | 17110016 | 0.490551 | 0.00000 | 18.9244 | 17110011 | 0.00000 | 0.490551 | 19.1329 |
| 1 | 17110012 | 0.488272 | 0.00227898 | 19.1397 | 17110014 | 0.000688040 | 0.489863 | 19.1566 |
| 2 | 17110013 | 0.488875 | 0.00167599 | 19.1355 | 17110015 | 0.000892560 | 0.489658 | 19.1517 |