| Red | Green | Blue | |
| z | 17.64 | ||
| znorm | Inf | ||
| sky | -Inf | -Inf | -NaN |
| S/N | 27.8 | 47.0 | 50.6 |
| S/N(c) | 0.0 | 0.0 | 0.0 |
| SN(E/C) |
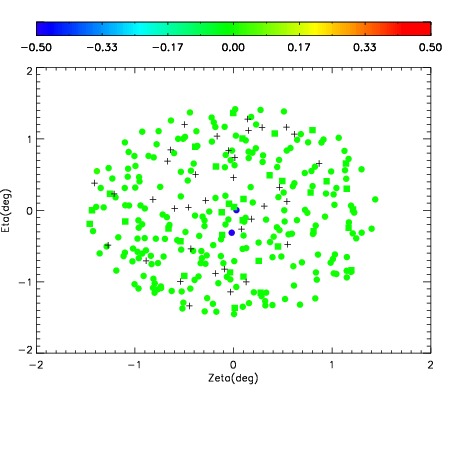
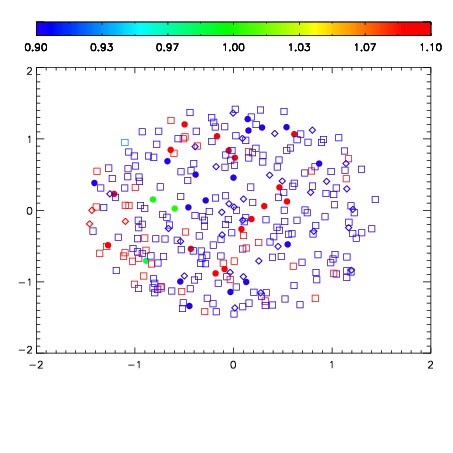


| Frame | Nreads | Zeropoints | Mag plots | Spatial mag deviation | Spatial sky 16325A emission deviations (filled: sky, open: star) | Spatial sky continuum emission | Spatial sky telluric CO2 absorption deviations (filled: H < 10) | |||||||||||||||||||||||
| 0 | 0 |
|
|
|
|
|
|
| IPAIR | NAME | SHIFT | NEWSHIFT | S/N | NAME | SHIFT | NEWSHIFT | S/N |
| 0 | 14300027 | 0.500764 | 0.00000 | 18.9905 | 14300022 | 0.00000 | 0.500764 | 19.0323 |
| 1 | 14300024 | 0.499868 | 0.000896007 | 19.1157 | 14300025 | -0.000971454 | 0.501735 | 19.1228 |
| 2 | 14300028 | 0.500701 | 6.30021e-05 | 19.0771 | 14300026 | -0.00101921 | 0.501783 | 19.0873 |
| 3 | 14300023 | 0.499558 | 0.00120601 | 19.0731 | 14300029 | -0.000677964 | 0.501442 | 19.0488 |