| Red | Green | Blue | |
| z | 17.64 | ||
| znorm | Inf | ||
| sky | -Inf | -Inf | -Inf |
| S/N | 23.5 | 39.7 | 40.6 |
| S/N(c) | 0.0 | 0.0 | 0.0 |
| SN(E/C) |
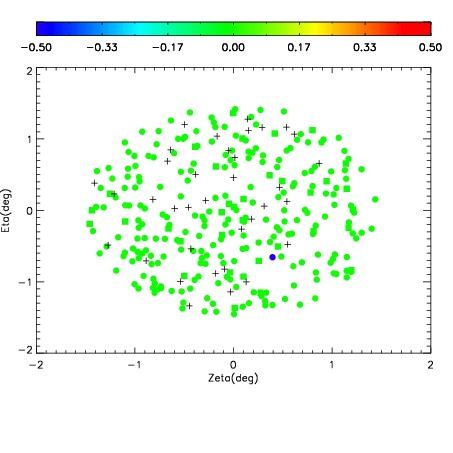
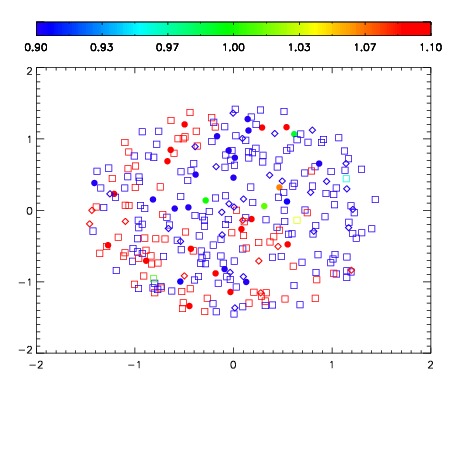


| Frame | Nreads | Zeropoints | Mag plots | Spatial mag deviation | Spatial sky 16325A emission deviations (filled: sky, open: star) | Spatial sky continuum emission | Spatial sky telluric CO2 absorption deviations (filled: H < 10) | |||||||||||||||||||||||
| 0 | 0 |
|
|
|
|
|
|
| IPAIR | NAME | SHIFT | NEWSHIFT | S/N | NAME | SHIFT | NEWSHIFT | S/N |
| 0 | 14370028 | 0.495381 | 0.00000 | 18.8142 | 14370029 | 0.000318282 | 0.495063 | 18.6938 |
| 1 | 14370027 | 0.494068 | 0.00131300 | 18.8429 | 14370033 | -0.000579400 | 0.495960 | 18.8838 |
| 2 | 14370032 | 0.495020 | 0.000360996 | 18.6109 | 14370026 | 0.00000 | 0.495381 | 18.6938 |
| 3 | 14370031 | 0.494785 | 0.000595987 | 18.5879 | 14370030 | -0.000189243 | 0.495570 | 18.3802 |