| Red | Green | Blue | |
| z | 17.64 | ||
| znorm | Inf | ||
| sky | -Inf | -Inf | -Inf |
| S/N | 17.8 | 32.4 | 35.0 |
| S/N(c) | 0.0 | 0.0 | 0.0 |
| SN(E/C) |

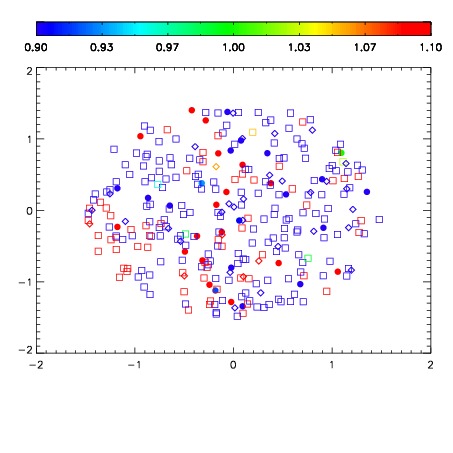
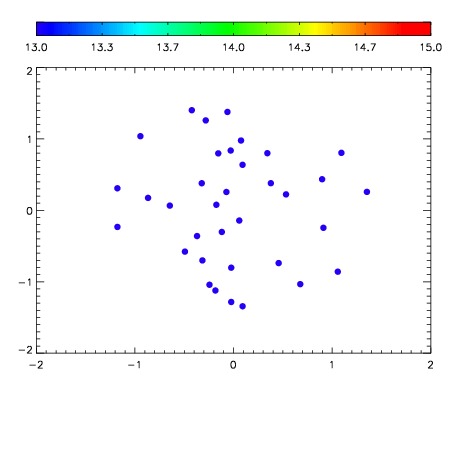

| Frame | Nreads | Zeropoints | Mag plots | Spatial mag deviation | Spatial sky 16325A emission deviations (filled: sky, open: star) | Spatial sky continuum emission | Spatial sky telluric CO2 absorption deviations (filled: H < 10) | |||||||||||||||||||||||
| 0 | 0 |
|
|
|
|
|
|
| IPAIR | NAME | SHIFT | NEWSHIFT | S/N | NAME | SHIFT | NEWSHIFT | S/N |
| 0 | 14310029 | 0.501028 | 0.00000 | 18.1836 | 14310030 | 0.00356779 | 0.497460 | 18.2588 |
| 1 | 14310025 | 0.497509 | 0.00351900 | 18.8003 | 14310023 | 0.00000 | 0.501028 | 18.7676 |
| 2 | 14310024 | 0.496665 | 0.00436300 | 18.7085 | 14310027 | 0.00126149 | 0.499766 | 18.5651 |
| 3 | 14310028 | 0.499155 | 0.00187299 | 18.6618 | 14310026 | 0.00120802 | 0.499820 | 18.4419 |