| Red | Green | Blue | |
| z | 17.64 | ||
| znorm | Inf | ||
| sky | -Inf | -Inf | -NaN |
| S/N | 32.0 | 50.8 | 60.2 |
| S/N(c) | 0.0 | 0.0 | 0.0 |
| SN(E/C) |
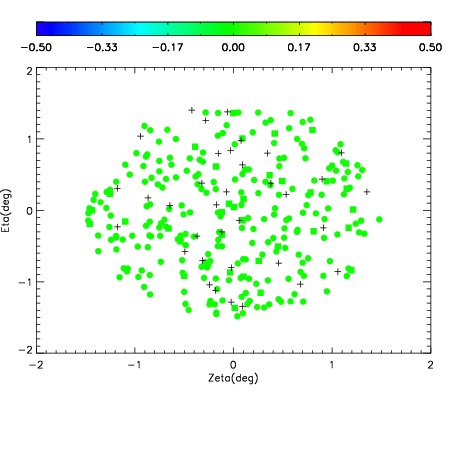
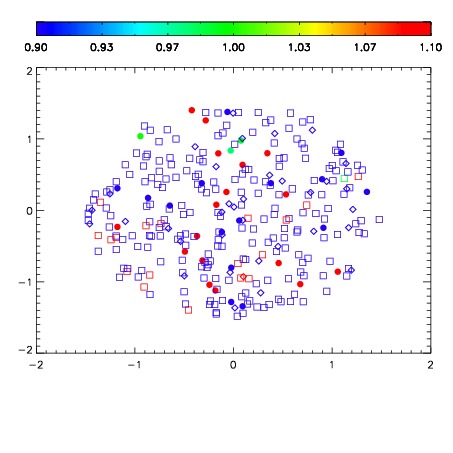
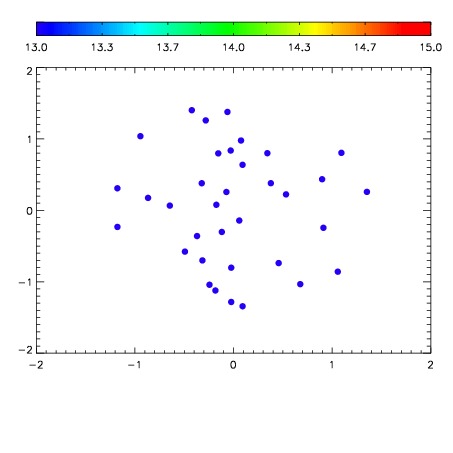

| Frame | Nreads | Zeropoints | Mag plots | Spatial mag deviation | Spatial sky 16325A emission deviations (filled: sky, open: star) | Spatial sky continuum emission | Spatial sky telluric CO2 absorption deviations (filled: H < 10) | |||||||||||||||||||||||
| 0 | 0 |
|
|
|
|
|
|
| IPAIR | NAME | SHIFT | NEWSHIFT | S/N | NAME | SHIFT | NEWSHIFT | S/N |
| 0 | 17040052 | 0.486088 | 0.00000 | 18.4804 | 17040051 | 0.00000 | 0.486088 | 18.1965 |
| 1 | 17040060 | 0.483482 | 0.00260600 | 19.1189 | 17040059 | -0.000287585 | 0.486376 | 19.1254 |
| 2 | 17040057 | 0.483275 | 0.00281301 | 19.1059 | 17040062 | 0.000871331 | 0.485217 | 19.1216 |
| 3 | 17040056 | 0.483649 | 0.00243902 | 19.1056 | 17040058 | -0.000388690 | 0.486477 | 19.1118 |
| 4 | 17040061 | 0.484900 | 0.00118801 | 19.1008 | 17040055 | 0.000325733 | 0.485762 | 19.0615 |
| 5 | 17040053 | 0.485588 | 0.000499994 | 18.9049 | 17040054 | 0.000638350 | 0.485450 | 19.0597 |