| Red | Green | Blue | |
| z | 17.64 | ||
| znorm | Inf | ||
| sky | -Inf | -Inf | -NaN |
| S/N | 14.7 | 26.1 | 28.7 |
| S/N(c) | 0.0 | 0.0 | 0.0 |
| SN(E/C) |


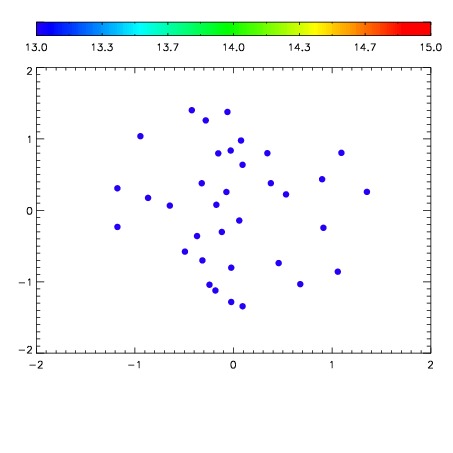

| Frame | Nreads | Zeropoints | Mag plots | Spatial mag deviation | Spatial sky 16325A emission deviations (filled: sky, open: star) | Spatial sky continuum emission | Spatial sky telluric CO2 absorption deviations (filled: H < 10) | |||||||||||||||||||||||
| 0 | 0 |
|
|
|
|
|
|
| IPAIR | NAME | SHIFT | NEWSHIFT | S/N | NAME | SHIFT | NEWSHIFT | S/N |
| 0 | 17070053 | 0.490260 | 0.00000 | 15.0566 | 17070054 | 0.000376297 | 0.489884 | 18.2586 |
| 1 | 17070048 | 0.483334 | 0.00692600 | 18.9991 | 17070050 | -0.000964766 | 0.491225 | 18.8537 |
| 2 | 17070049 | 0.486723 | 0.00353700 | 18.3163 | 17070047 | 0.00000 | 0.490260 | 18.4676 |
| 3 | 17070052 | 0.490005 | 0.000255018 | 14.1955 | 17070051 | -0.000113950 | 0.490374 | 18.0013 |