| Red | Green | Blue | |
| z | 17.63 | ||
| znorm | Inf | ||
| sky | -NaN | -NaN | -NaN |
| S/N | 24.5 | 43.6 | 46.7 |
| S/N(c) | 0.0 | 0.0 | 0.0 |
| SN(E/C) |
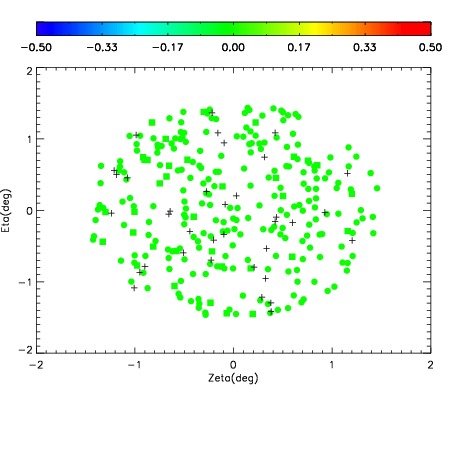
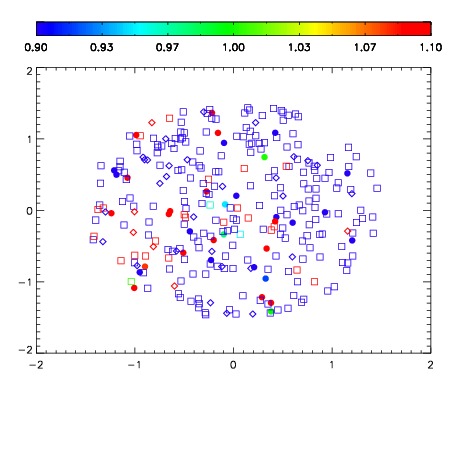
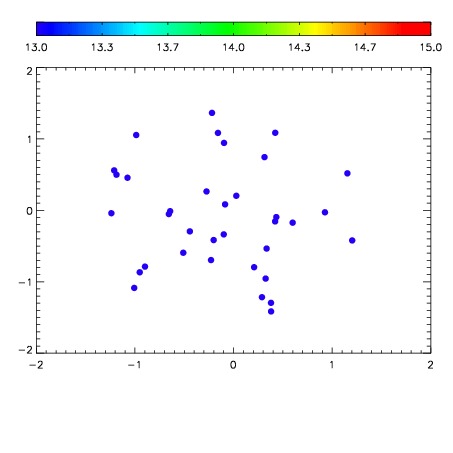

| Frame | Nreads | Zeropoints | Mag plots | Spatial mag deviation | Spatial sky 16325A emission deviations (filled: sky, open: star) | Spatial sky continuum emission | Spatial sky telluric CO2 absorption deviations (filled: H < 10) | |||||||||||||||||||||||
| 0 | 0 |
|
|
|
|
|
|
| IPAIR | NAME | SHIFT | NEWSHIFT | S/N | NAME | SHIFT | NEWSHIFT | S/N |
| 0 | 13810042 | 0.500966 | 0.00000 | 19.0173 | 13810043 | -0.000718588 | 0.501685 | 19.0437 |
| 1 | 13810046 | 0.499625 | 0.00134102 | 19.0068 | 13810040 | 0.00000 | 0.500966 | 19.0199 |
| 2 | 13810045 | 0.499693 | 0.00127301 | 18.9974 | 13810044 | -0.000556637 | 0.501523 | 18.9970 |
| 3 | 13810041 | 0.500224 | 0.000742018 | 18.9792 | 13810047 | -0.00117475 | 0.502141 | 18.8881 |