| Red | Green | Blue | |
| z | 17.64 | ||
| znorm | Inf | ||
| sky | -NaN | -Inf | -NaN |
| S/N | 19.7 | 36.1 | 40.4 |
| S/N(c) | 0.0 | 0.0 | 0.0 |
| SN(E/C) |

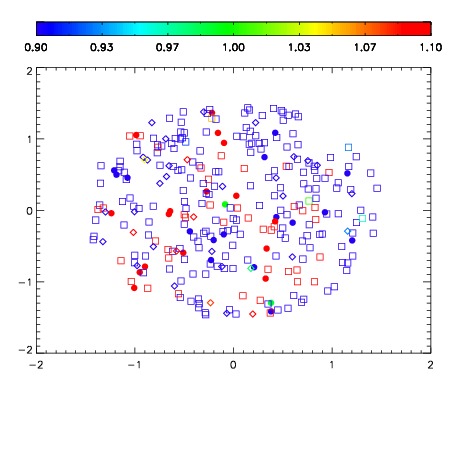
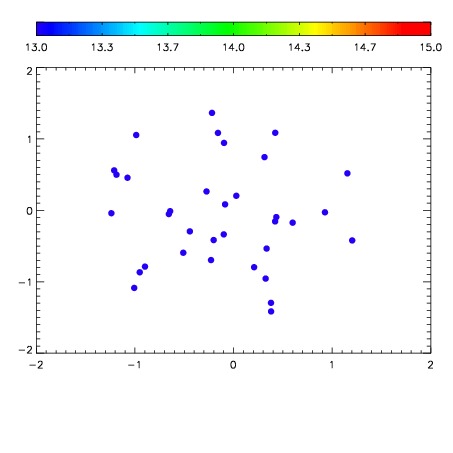

| Frame | Nreads | Zeropoints | Mag plots | Spatial mag deviation | Spatial sky 16325A emission deviations (filled: sky, open: star) | Spatial sky continuum emission | Spatial sky telluric CO2 absorption deviations (filled: H < 10) | |||||||||||||||||||||||
| 0 | 0 |
|
|
|
|
|
|
| IPAIR | NAME | SHIFT | NEWSHIFT | S/N | NAME | SHIFT | NEWSHIFT | S/N |
| 0 | 14100032 | 0.497554 | 0.00000 | 18.7812 | 14100033 | 1.57708e-06 | 0.497552 | 18.7734 |
| 1 | 14100031 | 0.497194 | 0.000360012 | 18.6836 | 14100026 | 0.00000 | 0.497554 | 18.7166 |
| 2 | 14100028 | 0.497518 | 3.60012e-05 | 18.5591 | 14100030 | 0.000129350 | 0.497425 | 18.6317 |
| 3 | 14100027 | 0.497140 | 0.000414014 | 18.5589 | 14100029 | -0.000165849 | 0.497720 | 18.5629 |