| Red | Green | Blue | |
| z | 17.64 | ||
| znorm | Inf | ||
| sky | -NaN | -Inf | -Inf |
| S/N | 29.8 | 50.0 | 56.3 |
| S/N(c) | 0.0 | 0.0 | 0.0 |
| SN(E/C) |
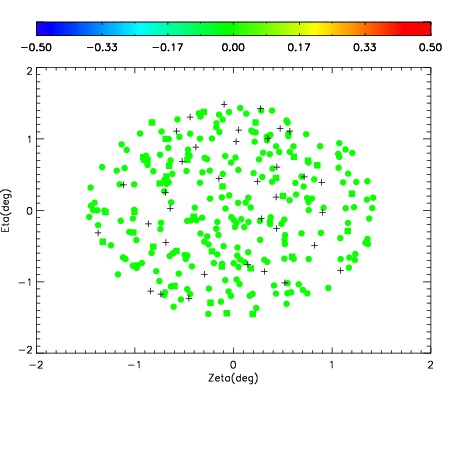
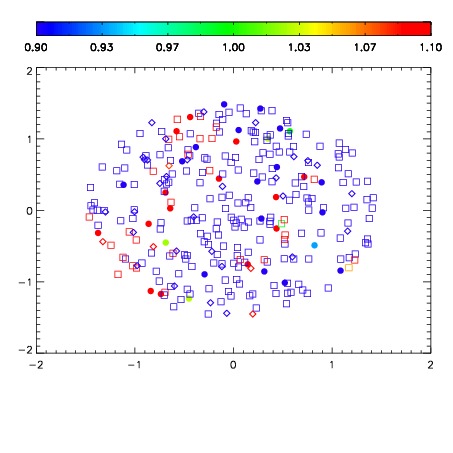
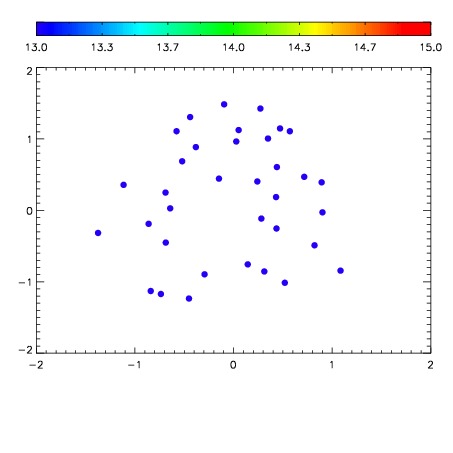

| Frame | Nreads | Zeropoints | Mag plots | Spatial mag deviation | Spatial sky 16325A emission deviations (filled: sky, open: star) | Spatial sky continuum emission | Spatial sky telluric CO2 absorption deviations (filled: H < 10) | |||||||||||||||||||||||
| 0 | 0 |
|
|
|
|
|
|
| IPAIR | NAME | SHIFT | NEWSHIFT | S/N | NAME | SHIFT | NEWSHIFT | S/N |
| 0 | 14290039 | 0.502818 | 0.00000 | 19.2064 | 14290041 | -0.000500554 | 0.503319 | 19.2161 |
| 1 | 14290042 | 0.501448 | 0.00137001 | 19.2038 | 14290040 | -0.000365770 | 0.503184 | 19.2129 |
| 2 | 14290038 | 0.502424 | 0.000393987 | 19.1927 | 14290044 | 0.000441757 | 0.502376 | 19.1680 |
| 3 | 14290043 | 0.502142 | 0.000675976 | 19.1626 | 14290037 | 0.00000 | 0.502818 | 19.1252 |