| Red | Green | Blue | |
| z | 17.64 | ||
| znorm | Inf | ||
| sky | -Inf | -Inf | -NaN |
| S/N | 6.2 | 11.4 | 12.9 |
| S/N(c) | 0.0 | 0.0 | 0.0 |
| SN(E/C) |
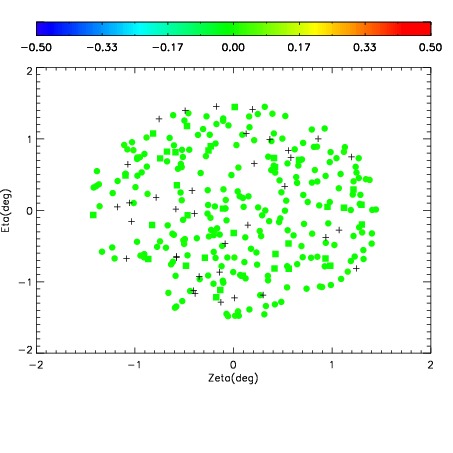
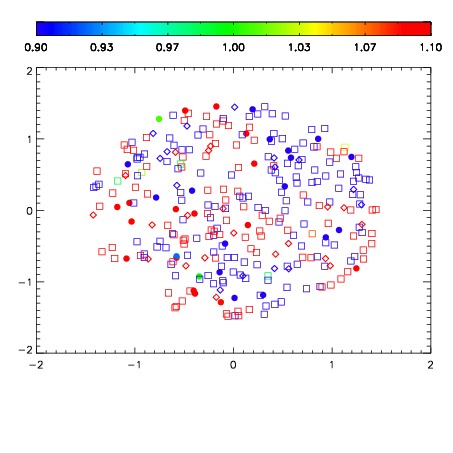
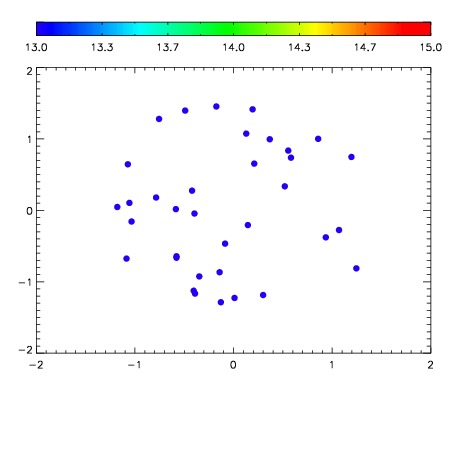

| Frame | Nreads | Zeropoints | Mag plots | Spatial mag deviation | Spatial sky 16325A emission deviations (filled: sky, open: star) | Spatial sky continuum emission | Spatial sky telluric CO2 absorption deviations (filled: H < 10) | |||||||||||||||||||||||
| 0 | 0 |
|
|
|
|
|
|
| IPAIR | NAME | SHIFT | NEWSHIFT | S/N | NAME | SHIFT | NEWSHIFT | S/N |
| 0 | 13750070 | 0.505155 | 0.00000 | 16.9908 | 13750072 | -0.00175449 | 0.506909 | 16.7599 |
| 1 | 13750074 | 0.503113 | 0.00204206 | 17.6182 | 13750075 | -0.00308408 | 0.508239 | 18.0650 |
| 2 | 13750073 | 0.503043 | 0.00211203 | 17.3009 | 13750068 | 0.00000 | 0.505155 | 17.5765 |
| 3 | 13750069 | 0.504946 | 0.000209033 | 17.1132 | 13750071 | -0.00150805 | 0.506663 | 17.3074 |