| Red | Green | Blue | |
| z | 17.64 | ||
| znorm | Inf | ||
| sky | -Inf | -Inf | -NaN |
| S/N | 26.5 | 44.8 | 50.7 |
| S/N(c) | 0.0 | 0.0 | 0.0 |
| SN(E/C) |


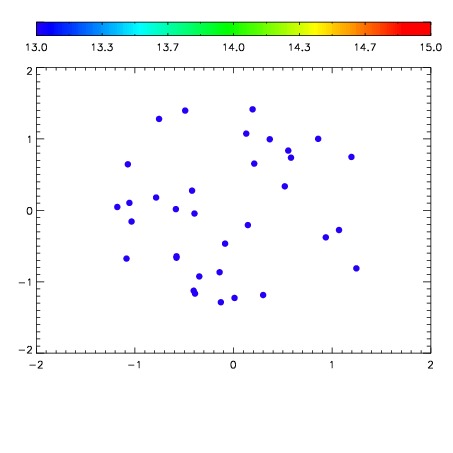

| Frame | Nreads | Zeropoints | Mag plots | Spatial mag deviation | Spatial sky 16325A emission deviations (filled: sky, open: star) | Spatial sky continuum emission | Spatial sky telluric CO2 absorption deviations (filled: H < 10) | |||||||||||||||||||||||
| 0 | 0 |
|
|
|
|
|
|
| IPAIR | NAME | SHIFT | NEWSHIFT | S/N | NAME | SHIFT | NEWSHIFT | S/N |
| 0 | 14090031 | 0.496559 | 0.00000 | 19.0188 | 14090029 | -0.000302189 | 0.496861 | 19.1337 |
| 1 | 14090028 | 0.494528 | 0.00203100 | 19.0038 | 14090030 | -0.000852532 | 0.497412 | 19.0802 |
| 2 | 14090032 | 0.496444 | 0.000115007 | 18.8553 | 14090033 | -0.00183334 | 0.498392 | 19.0636 |
| 3 | 14090027 | 0.494709 | 0.00184998 | 18.8510 | 14090026 | 0.00000 | 0.496559 | 18.7306 |