| Red | Green | Blue | |
| z | 17.64 | ||
| znorm | Inf | ||
| sky | -NaN | -Inf | -Inf |
| S/N | 24.1 | 44.1 | 46.2 |
| S/N(c) | 0.0 | 0.0 | 0.0 |
| SN(E/C) |
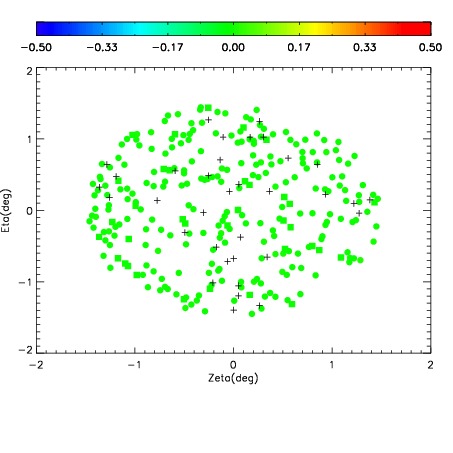
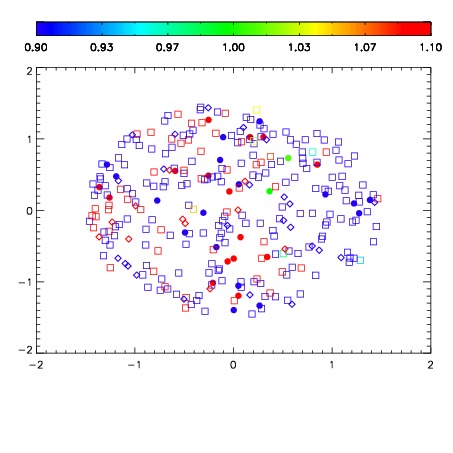
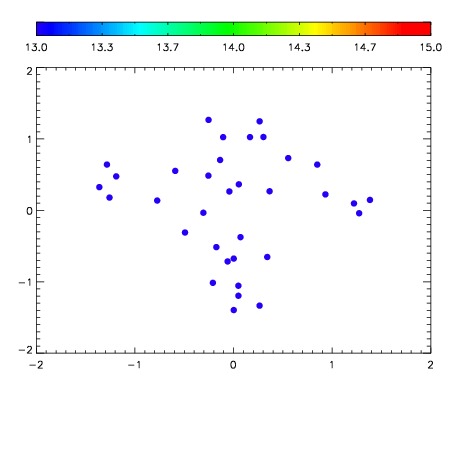

| Frame | Nreads | Zeropoints | Mag plots | Spatial mag deviation | Spatial sky 16325A emission deviations (filled: sky, open: star) | Spatial sky continuum emission | Spatial sky telluric CO2 absorption deviations (filled: H < 10) | |||||||||||||||||||||||
| 0 | 0 |
|
|
|
|
|
|
| IPAIR | NAME | SHIFT | NEWSHIFT | S/N | NAME | SHIFT | NEWSHIFT | S/N |
| 0 | 14090049 | 0.498429 | 0.00000 | 18.6656 | 14090052 | 0.000421307 | 0.498008 | 18.7681 |
| 1 | 14090054 | 0.498302 | 0.000126988 | 19.0087 | 14090055 | 0.000523505 | 0.497905 | 19.0087 |
| 2 | 14090053 | 0.497791 | 0.000638008 | 18.9356 | 14090051 | 0.000200435 | 0.498229 | 18.7928 |
| 3 | 14090050 | 0.498384 | 4.50015e-05 | 18.8548 | 14090048 | 0.00000 | 0.498429 | 18.7842 |