| Red | Green | Blue | |
| z | 17.64 | ||
| znorm | Inf | ||
| sky | -Inf | -Inf | -Inf |
| S/N | 26.0 | 45.6 | 48.3 |
| S/N(c) | 0.0 | 0.0 | 0.0 |
| SN(E/C) |
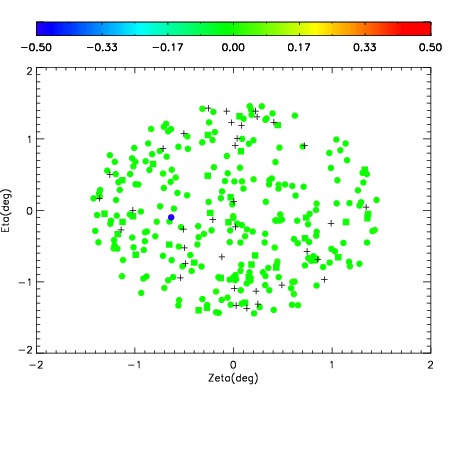
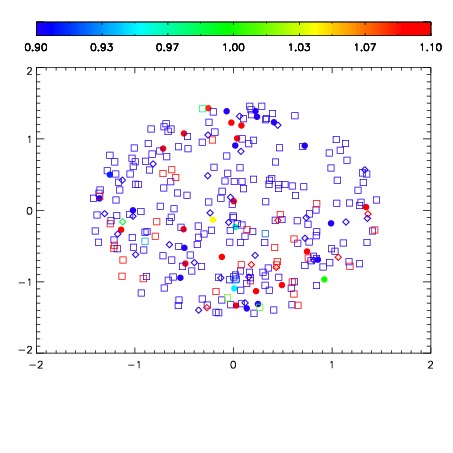
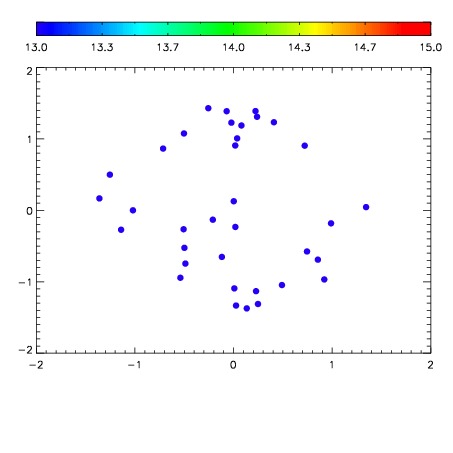

| Frame | Nreads | Zeropoints | Mag plots | Spatial mag deviation | Spatial sky 16325A emission deviations (filled: sky, open: star) | Spatial sky continuum emission | Spatial sky telluric CO2 absorption deviations (filled: H < 10) | |||||||||||||||||||||||
| 0 | 0 |
|
|
|
|
|
|
| IPAIR | NAME | SHIFT | NEWSHIFT | S/N | NAME | SHIFT | NEWSHIFT | S/N |
| 0 | 13740060 | 0.499974 | 0.00000 | 19.0448 | 13740066 | -0.00159512 | 0.501569 | 19.0812 |
| 1 | 13740065 | 0.498192 | 0.00178200 | 19.0937 | 13740059 | 0.00000 | 0.499974 | 19.0891 |
| 2 | 13740064 | 0.498354 | 0.00162002 | 19.0008 | 13740063 | -0.00296003 | 0.502934 | 19.0686 |
| 3 | 13740061 | 0.499818 | 0.000156015 | 18.9308 | 13740062 | -0.00169223 | 0.501666 | 19.0269 |