| Red | Green | Blue | |
| z | 17.64 | ||
| znorm | Inf | ||
| sky | -Inf | -Inf | -NaN |
| S/N | 23.3 | 40.6 | 45.2 |
| S/N(c) | 0.0 | 0.0 | 0.0 |
| SN(E/C) |
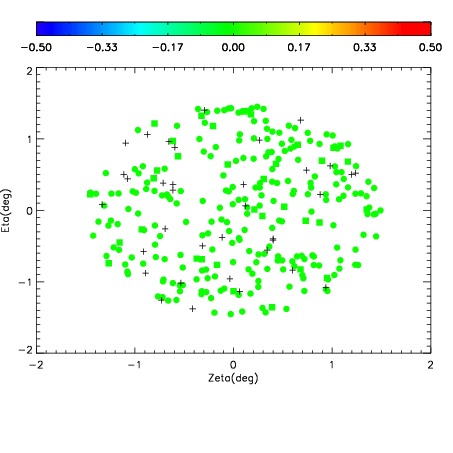
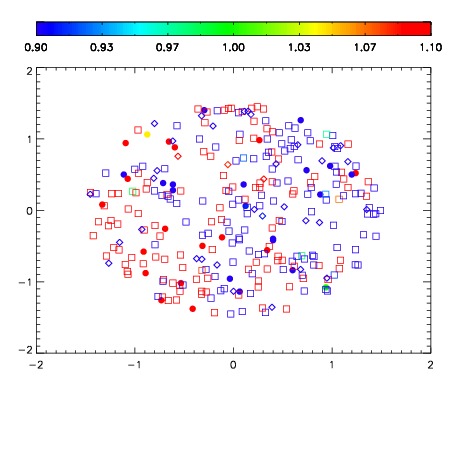
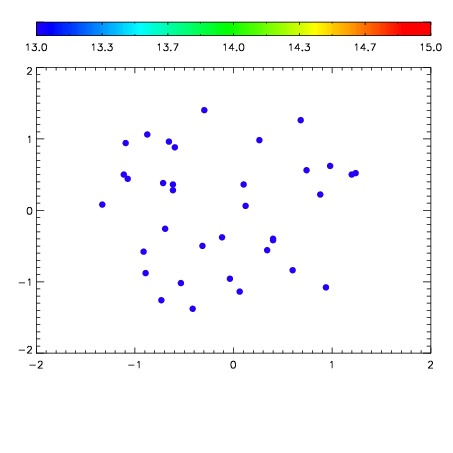

| Frame | Nreads | Zeropoints | Mag plots | Spatial mag deviation | Spatial sky 16325A emission deviations (filled: sky, open: star) | Spatial sky continuum emission | Spatial sky telluric CO2 absorption deviations (filled: H < 10) | |||||||||||||||||||||||
| 0 | 0 |
|
|
|
|
|
|
| IPAIR | NAME | SHIFT | NEWSHIFT | S/N | NAME | SHIFT | NEWSHIFT | S/N |
| 0 | 15820052 | 0.00205308 | 0.00000 | 18.8468 | 15820053 | -0.482880 | 0.484933 | 18.9037 |
| 1 | 15820055 | 0.00161558 | 0.000437500 | 19.0718 | 15820054 | -0.482796 | 0.484849 | 19.0336 |
| 2 | 15820051 | 0.00100453 | 0.00104855 | 18.7910 | 15820050 | -0.483086 | 0.485139 | 18.7850 |
| 3 | 15820048 | 0.00000 | 0.00205308 | 18.3693 | 15820049 | -0.483039 | 0.485092 | 18.6410 |