| Red | Green | Blue | |
| z | 17.64 | ||
| znorm | Inf | ||
| sky | -Inf | -Inf | -Inf |
| S/N | 23.8 | 41.6 | 44.7 |
| S/N(c) | 0.0 | 0.0 | 0.0 |
| SN(E/C) |
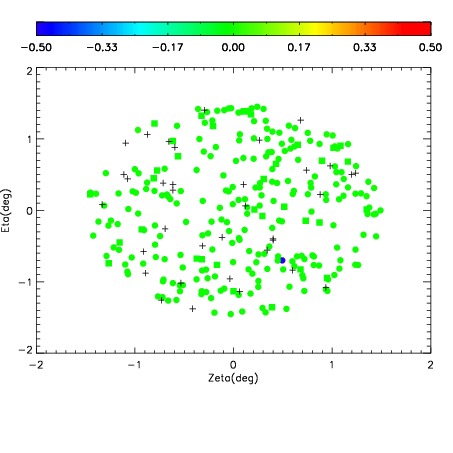
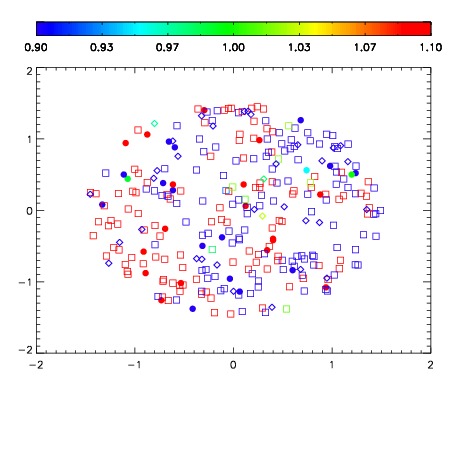
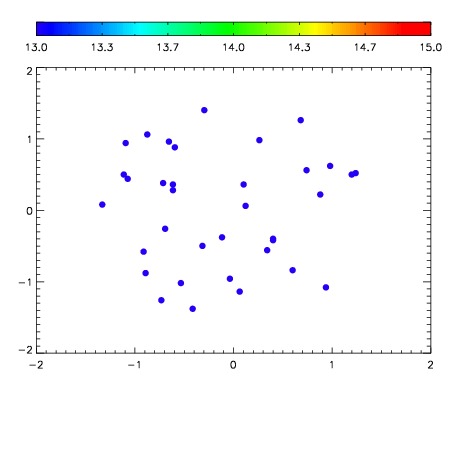

| Frame | Nreads | Zeropoints | Mag plots | Spatial mag deviation | Spatial sky 16325A emission deviations (filled: sky, open: star) | Spatial sky continuum emission | Spatial sky telluric CO2 absorption deviations (filled: H < 10) | |||||||||||||||||||||||
| 0 | 0 |
|
|
|
|
|
|
| IPAIR | NAME | SHIFT | NEWSHIFT | S/N | NAME | SHIFT | NEWSHIFT | S/N |
| 0 | 15900061 | 0.00194964 | 0.00000 | 18.8792 | 15900056 | -0.487258 | 0.489208 | 18.7722 |
| 1 | 15900057 | 0.000556268 | 0.00139337 | 18.9236 | 15900059 | -0.488034 | 0.489984 | 18.9386 |
| 2 | 15900058 | 0.00102693 | 0.000922710 | 18.8959 | 15900060 | -0.487180 | 0.489130 | 18.8147 |
| 3 | 15900054 | 0.00000 | 0.00194964 | 18.7975 | 15900055 | -0.486625 | 0.488575 | 18.7683 |