| Red | Green | Blue | |
| z | 17.64 | ||
| znorm | Inf | ||
| sky | -Inf | -Inf | -NaN |
| S/N | 27.6 | 47.6 | 50.2 |
| S/N(c) | 0.0 | 0.0 | 0.0 |
| SN(E/C) |
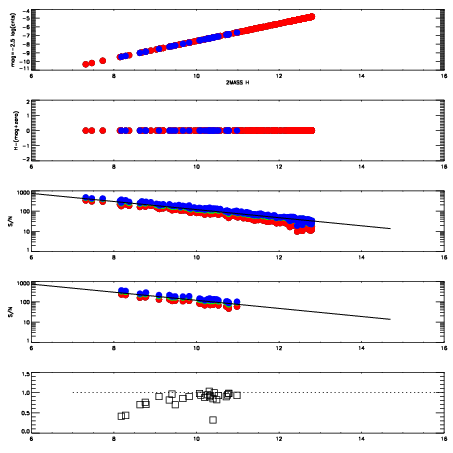
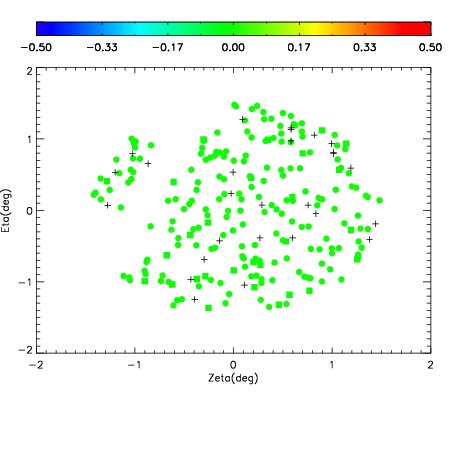
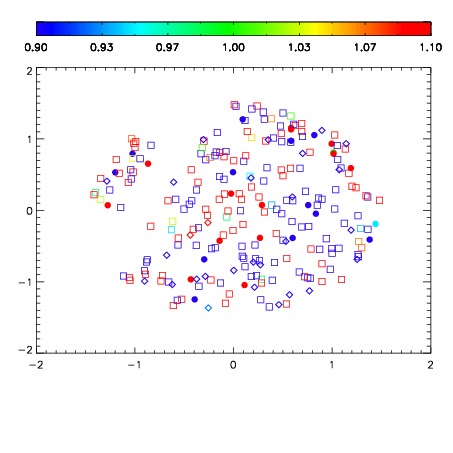
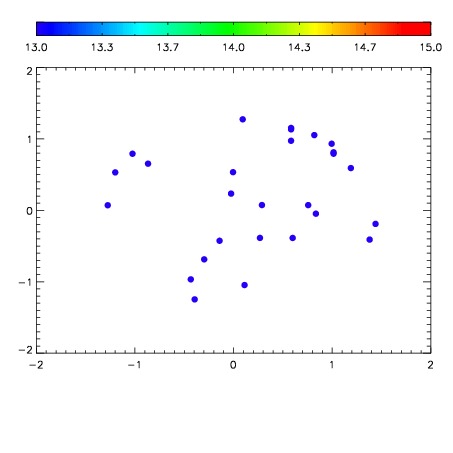

| Frame | Nreads | Zeropoints | Mag plots | Spatial mag deviation | Spatial sky 16325A emission deviations (filled: sky, open: star) | Spatial sky continuum emission | Spatial sky telluric CO2 absorption deviations (filled: H < 10) | |||||||||||||||||||||||
| 0 | 0 |
|
|
|
|
|
|
| IPAIR | NAME | SHIFT | NEWSHIFT | S/N | NAME | SHIFT | NEWSHIFT | S/N |
| 0 | 16400039 | 0.493997 | 0.00000 | 18.9132 | 16400040 | 0.00242825 | 0.491569 | 18.9580 |
| 1 | 16400034 | 0.492289 | 0.00170800 | 18.9589 | 16400037 | 0.000859345 | 0.493138 | 18.9981 |
| 2 | 16400038 | 0.492829 | 0.00116801 | 18.9570 | 16400033 | 0.00000 | 0.493997 | 18.9979 |
| 3 | 16400035 | 0.493084 | 0.000912994 | 18.9050 | 16400036 | 0.000968153 | 0.493029 | 18.9374 |