| Red | Green | Blue | |
| z | 17.64 | ||
| znorm | Inf | ||
| sky | -Inf | -Inf | -Inf |
| S/N | 26.4 | 48.1 | 52.8 |
| S/N(c) | 0.0 | 0.0 | 0.0 |
| SN(E/C) |
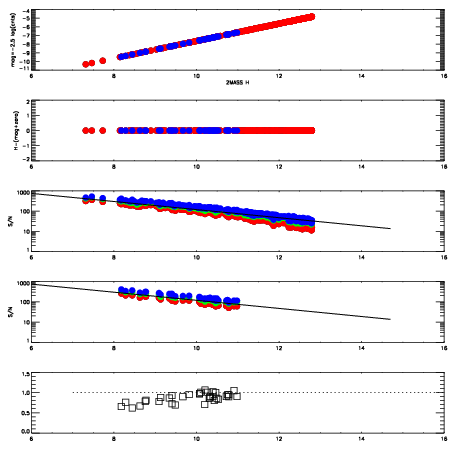
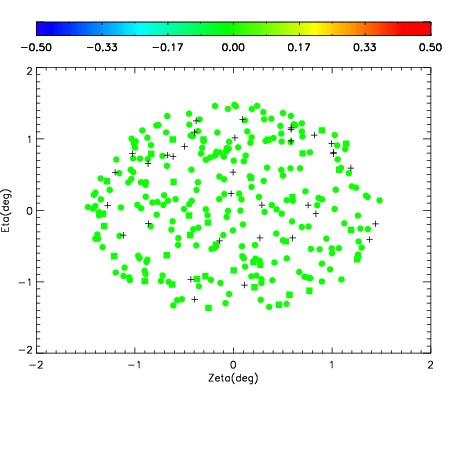
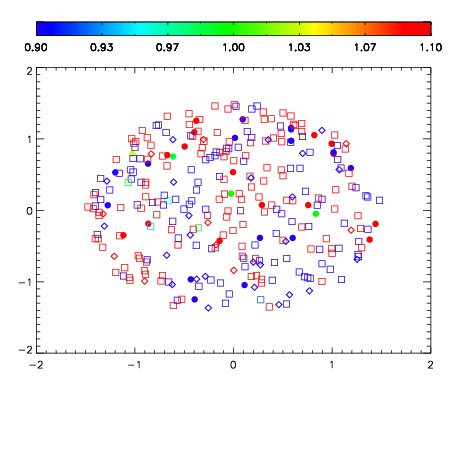
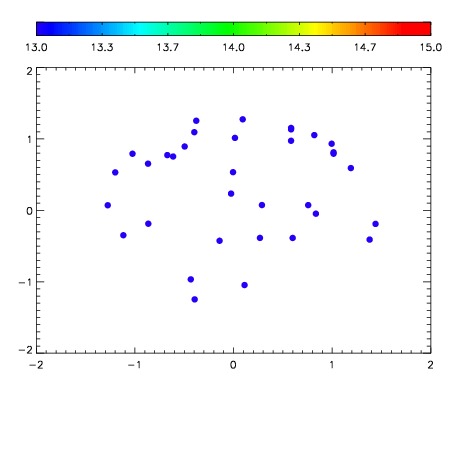

| Frame | Nreads | Zeropoints | Mag plots | Spatial mag deviation | Spatial sky 16325A emission deviations (filled: sky, open: star) | Spatial sky continuum emission | Spatial sky telluric CO2 absorption deviations (filled: H < 10) | |||||||||||||||||||||||
| 0 | 0 |
|
|
|
|
|
|
| IPAIR | NAME | SHIFT | NEWSHIFT | S/N | NAME | SHIFT | NEWSHIFT | S/N |
| 0 | 17310012 | 0.508128 | 0.00000 | 19.0437 | 17310010 | 0.00000 | 0.508128 | 19.0428 |
| 1 | 17310016 | 0.507726 | 0.000401974 | 19.0846 | 17310017 | 0.00143833 | 0.506690 | 19.0874 |
| 2 | 17310011 | 0.507828 | 0.000299990 | 19.0699 | 17310014 | 0.000848702 | 0.507279 | 19.0576 |
| 3 | 17310015 | 0.506898 | 0.00123000 | 19.0557 | 17310013 | 0.000953809 | 0.507174 | 19.0534 |