| Red | Green | Blue | |
| z | 17.64 | ||
| znorm | Inf | ||
| sky | -NaN | -NaN | -NaN |
| S/N | 29.6 | 47.6 | 56.1 |
| S/N(c) | 0.0 | 0.0 | 0.0 |
| SN(E/C) |
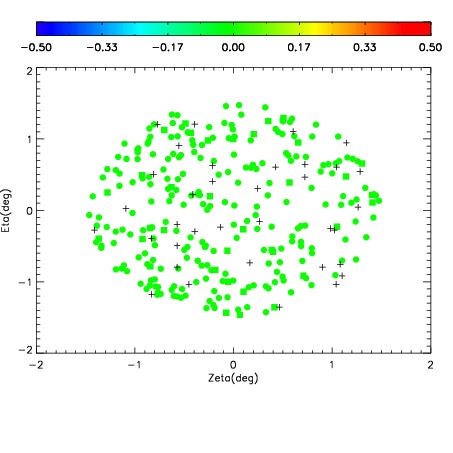
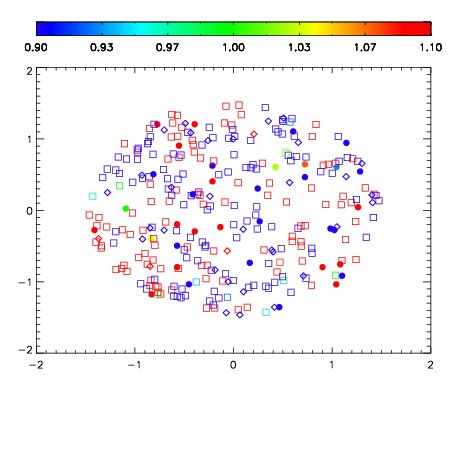
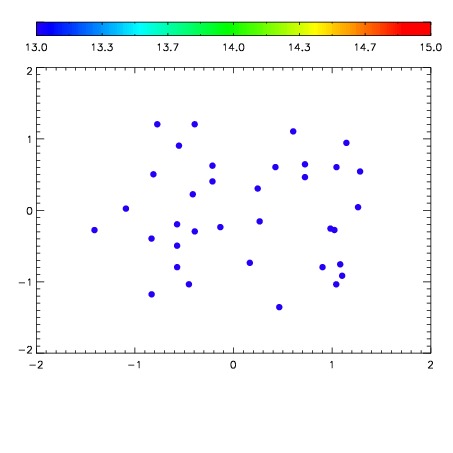

| Frame | Nreads | Zeropoints | Mag plots | Spatial mag deviation | Spatial sky 16325A emission deviations (filled: sky, open: star) | Spatial sky continuum emission | Spatial sky telluric CO2 absorption deviations (filled: H < 10) | |||||||||||||||||||||||
| 0 | 0 |
|
|
|
|
|
|
| IPAIR | NAME | SHIFT | NEWSHIFT | S/N | NAME | SHIFT | NEWSHIFT | S/N |
| 0 | 13410031 | 0.510295 | 0.00000 | 19.0275 | 13410033 | -9.03629e-05 | 0.510385 | 18.9315 |
| 1 | 13410028 | 0.509021 | 0.00127399 | 19.0615 | 13410030 | 0.000690975 | 0.509604 | 19.0492 |
| 2 | 13410032 | 0.510037 | 0.000257969 | 19.0447 | 13410026 | 0.00000 | 0.510295 | 18.9943 |
| 3 | 13410027 | 0.508578 | 0.00171697 | 19.0370 | 13410029 | 0.00122348 | 0.509071 | 18.9657 |