| Red | Green | Blue | |
| z | 17.64 | ||
| znorm | Inf | ||
| sky | -Inf | -Inf | -NaN |
| S/N | 31.8 | 50.0 | 55.6 |
| S/N(c) | 0.0 | 0.0 | 0.0 |
| SN(E/C) |
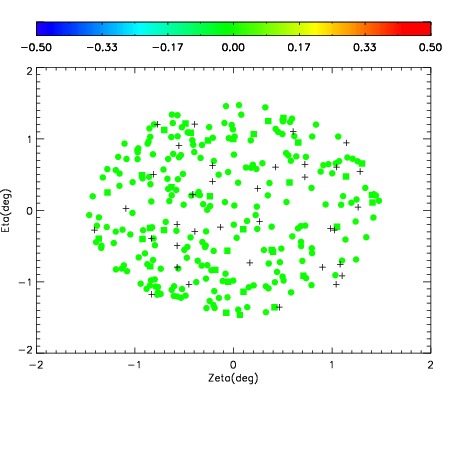
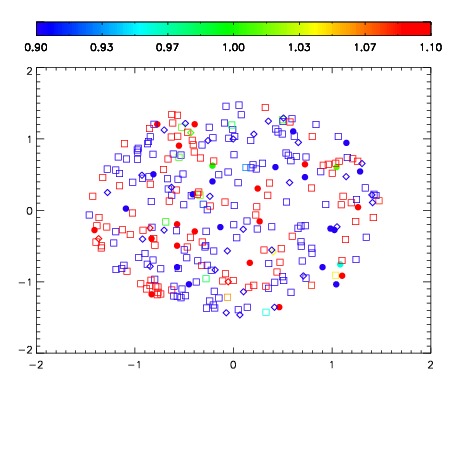
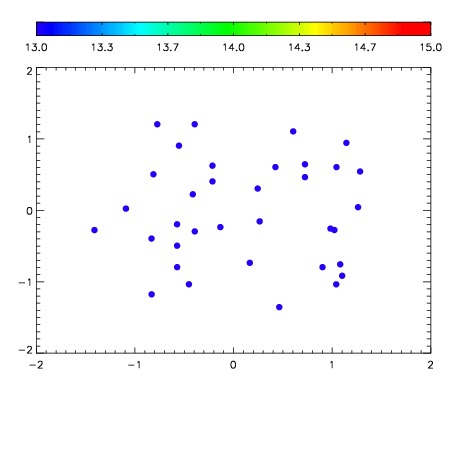

| Frame | Nreads | Zeropoints | Mag plots | Spatial mag deviation | Spatial sky 16325A emission deviations (filled: sky, open: star) | Spatial sky continuum emission | Spatial sky telluric CO2 absorption deviations (filled: H < 10) | |||||||||||||||||||||||
| 0 | 0 |
|
|
|
|
|
|
| IPAIR | NAME | SHIFT | NEWSHIFT | S/N | NAME | SHIFT | NEWSHIFT | S/N |
| 0 | 13700013 | 0.502537 | 0.00000 | 18.8986 | 13700015 | -0.00231417 | 0.504851 | 18.9588 |
| 1 | 13700016 | 0.501208 | 0.00132900 | 19.0269 | 13700018 | -0.00137879 | 0.503916 | 19.0511 |
| 2 | 13700017 | 0.501535 | 0.00100201 | 18.9883 | 13700014 | -0.00266736 | 0.505204 | 18.9596 |
| 3 | 13700012 | 0.502083 | 0.000454009 | 18.8183 | 13700011 | 0.00000 | 0.502537 | 18.9379 |