| Red | Green | Blue | |
| z | 17.64 | ||
| znorm | Inf | ||
| sky | -NaN | -Inf | -NaN |
| S/N | 23.3 | 41.1 | 43.9 |
| S/N(c) | 0.0 | 0.0 | 0.0 |
| SN(E/C) |
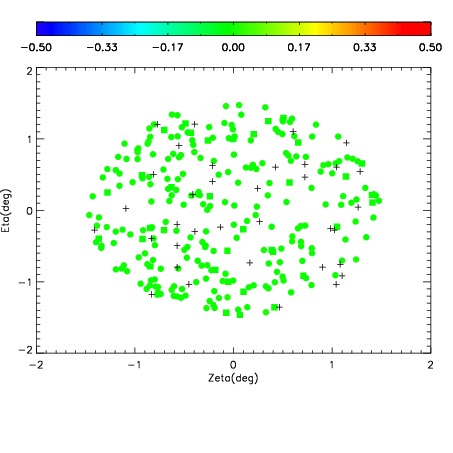
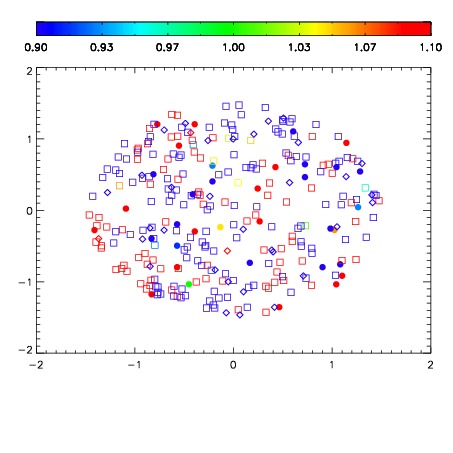
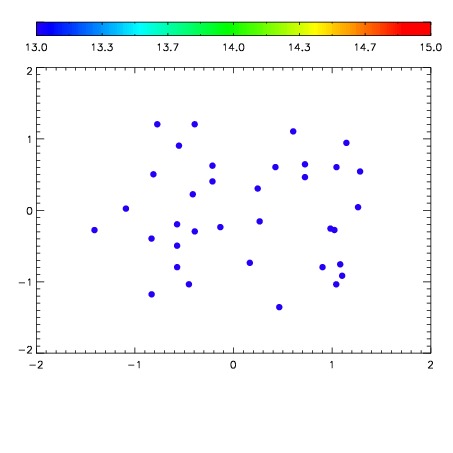

| Frame | Nreads | Zeropoints | Mag plots | Spatial mag deviation | Spatial sky 16325A emission deviations (filled: sky, open: star) | Spatial sky continuum emission | Spatial sky telluric CO2 absorption deviations (filled: H < 10) | |||||||||||||||||||||||
| 0 | 0 |
|
|
|
|
|
|
| IPAIR | NAME | SHIFT | NEWSHIFT | S/N | NAME | SHIFT | NEWSHIFT | S/N |
| 0 | 16110049 | 0.493348 | 0.00000 | 18.9134 | 16110048 | 0.00227307 | 0.491075 | 18.9453 |
| 1 | 16110045 | 0.492473 | 0.000874996 | 19.0185 | 16110047 | 0.00222018 | 0.491128 | 19.0057 |
| 2 | 16110046 | 0.492882 | 0.000465989 | 18.9838 | 16110044 | 0.00000 | 0.493348 | 18.9820 |