| Red | Green | Blue | |
| z | 17.64 | ||
| znorm | Inf | ||
| sky | -Inf | -Inf | -NaN |
| S/N | 24.9 | 42.3 | 44.7 |
| S/N(c) | 0.0 | 0.0 | 0.0 |
| SN(E/C) |
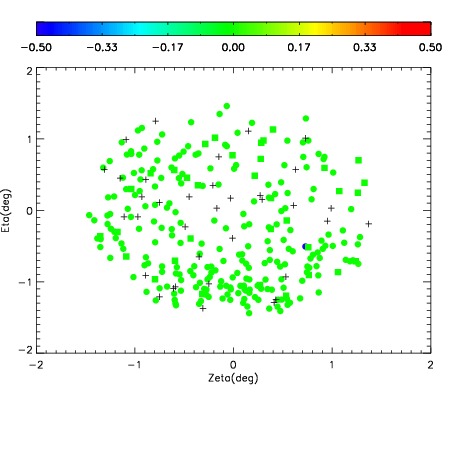


| Frame | Nreads | Zeropoints | Mag plots | Spatial mag deviation | Spatial sky 16325A emission deviations (filled: sky, open: star) | Spatial sky continuum emission | Spatial sky telluric CO2 absorption deviations (filled: H < 10) | |||||||||||||||||||||||
| 0 | 0 |
|
|
|
|
|
|
| IPAIR | NAME | SHIFT | NEWSHIFT | S/N | NAME | SHIFT | NEWSHIFT | S/N |
| 0 | 15920028 | 0.496257 | 0.00000 | 18.9954 | 15920029 | 0.00420584 | 0.492051 | 19.0044 |
| 1 | 15920027 | 0.495443 | 0.000814021 | 18.9870 | 15920026 | 0.00172752 | 0.494529 | 18.9697 |
| 2 | 15920024 | 0.495793 | 0.000463992 | 18.9299 | 15920025 | 0.00227090 | 0.493986 | 18.9678 |
| 3 | 15920023 | 0.495470 | 0.000787020 | 18.8105 | 15920022 | 0.00000 | 0.496257 | 18.6263 |