| Red | Green | Blue | |
| z | 17.64 | ||
| znorm | Inf | ||
| sky | -Inf | -Inf | -NaN |
| S/N | 23.6 | 39.1 | 38.6 |
| S/N(c) | 0.0 | 0.0 | 0.0 |
| SN(E/C) |
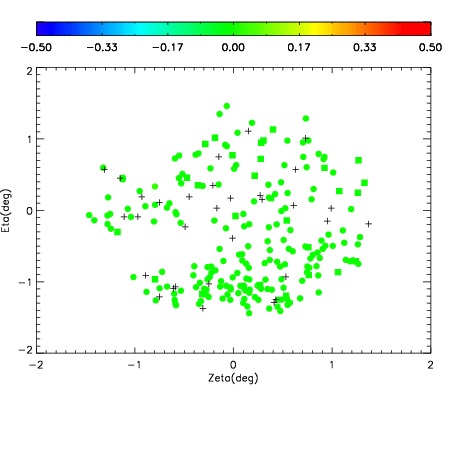
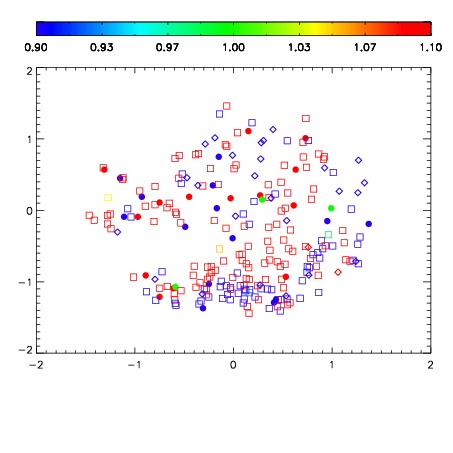


| Frame | Nreads | Zeropoints | Mag plots | Spatial mag deviation | Spatial sky 16325A emission deviations (filled: sky, open: star) | Spatial sky continuum emission | Spatial sky telluric CO2 absorption deviations (filled: H < 10) | |||||||||||||||||||||||
| 0 | 0 |
|
|
|
|
|
|
| IPAIR | NAME | SHIFT | NEWSHIFT | S/N | NAME | SHIFT | NEWSHIFT | S/N |
| 0 | 16420042 | 0.489721 | 0.00000 | 18.5991 | 16420036 | 0.00000 | 0.489721 | 18.6446 |
| 1 | 16420041 | 0.488354 | 0.00136700 | 18.8885 | 16420040 | 0.000191829 | 0.489529 | 18.9608 |
| 2 | 16420038 | 0.488968 | 0.000752985 | 18.7716 | 16420039 | 6.98939e-05 | 0.489651 | 18.8992 |
| 3 | 16420037 | 0.486903 | 0.00281799 | 18.7235 | 16420043 | 0.00189686 | 0.487824 | 18.6876 |