| Red | Green | Blue | |
| z | 17.63 | ||
| znorm | Inf | ||
| sky | -NaN | -Inf | -Inf |
| S/N | 27.2 | 42.2 | 43.3 |
| S/N(c) | 0.0 | 0.0 | 0.0 |
| SN(E/C) |
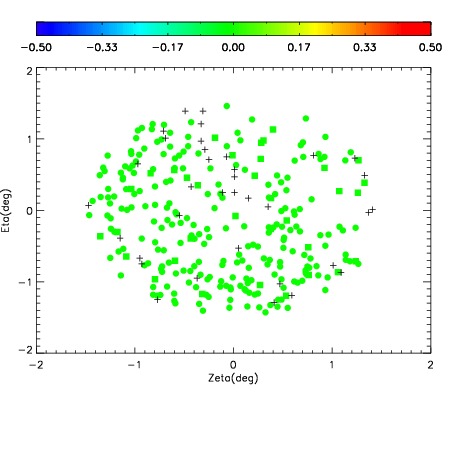
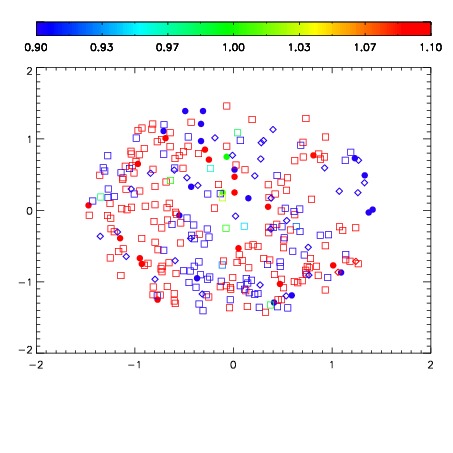


| Frame | Nreads | Zeropoints | Mag plots | Spatial mag deviation | Spatial sky 16325A emission deviations (filled: sky, open: star) | Spatial sky continuum emission | Spatial sky telluric CO2 absorption deviations (filled: H < 10) | |||||||||||||||||||||||
| 0 | 0 |
|
|
|
|
|
|
| IPAIR | NAME | SHIFT | NEWSHIFT | S/N | NAME | SHIFT | NEWSHIFT | S/N |
| 0 | 16110035 | 0.495902 | 0.00000 | 18.9724 | 16110037 | 0.00198522 | 0.493917 | 18.9658 |
| 1 | 16110039 | 0.495407 | 0.000495017 | 18.9512 | 16110040 | 0.00407838 | 0.491824 | 18.9627 |
| 2 | 16110038 | 0.494559 | 0.00134301 | 18.8796 | 16110036 | 0.00207197 | 0.493830 | 18.9610 |
| 3 | 16110034 | 0.494815 | 0.00108701 | 18.8701 | 16110033 | 0.00000 | 0.495902 | 18.8576 |