| Red | Green | Blue | |
| z | 17.64 | ||
| znorm | Inf | ||
| sky | -Inf | -Inf | -NaN |
| S/N | 26.8 | 41.1 | 43.2 |
| S/N(c) | 0.0 | 0.0 | 0.0 |
| SN(E/C) |
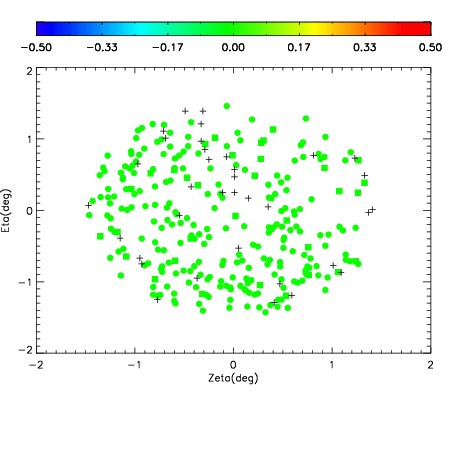
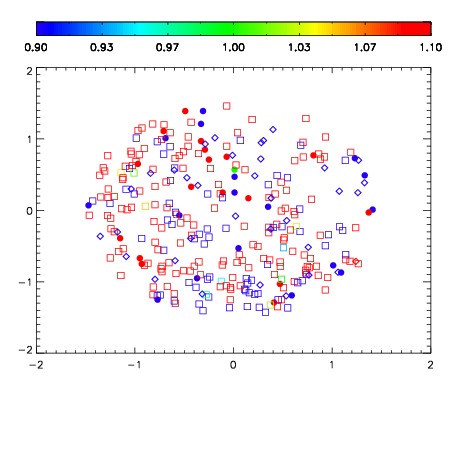
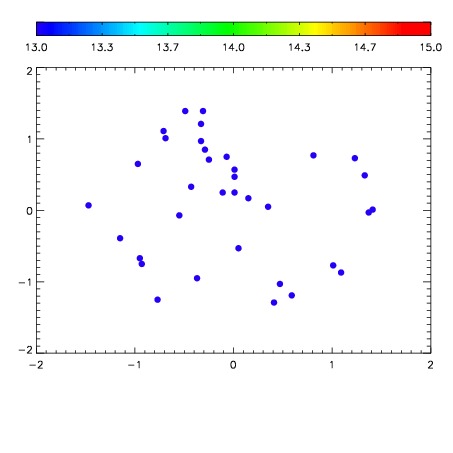

| Frame | Nreads | Zeropoints | Mag plots | Spatial mag deviation | Spatial sky 16325A emission deviations (filled: sky, open: star) | Spatial sky continuum emission | Spatial sky telluric CO2 absorption deviations (filled: H < 10) | |||||||||||||||||||||||
| 0 | 0 |
|
|
|
|
|
|
| IPAIR | NAME | SHIFT | NEWSHIFT | S/N | NAME | SHIFT | NEWSHIFT | S/N |
| 0 | 17030013 | 0.484227 | 0.00000 | 19.0013 | 17030011 | 0.00000 | 0.484227 | 18.9757 |
| 1 | 17030016 | 0.482941 | 0.00128600 | 18.9628 | 17030015 | -0.00312118 | 0.487348 | 18.9695 |
| 2 | 17030012 | 0.484123 | 0.000104010 | 18.9392 | 17030018 | -0.00279995 | 0.487027 | 18.9446 |
| 3 | 17030017 | 0.482865 | 0.00136200 | 18.9234 | 17030014 | -0.00283190 | 0.487059 | 18.9412 |