| Red | Green | Blue | |
| z | 17.64 | ||
| znorm | Inf | ||
| sky | -Inf | -NaN | -NaN |
| S/N | 31.1 | 48.6 | 50.2 |
| S/N(c) | 0.0 | 0.0 | 0.0 |
| SN(E/C) |
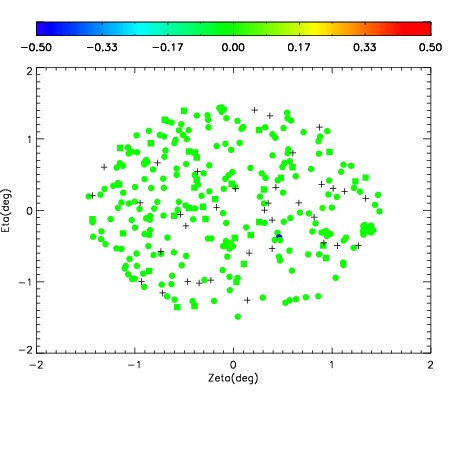
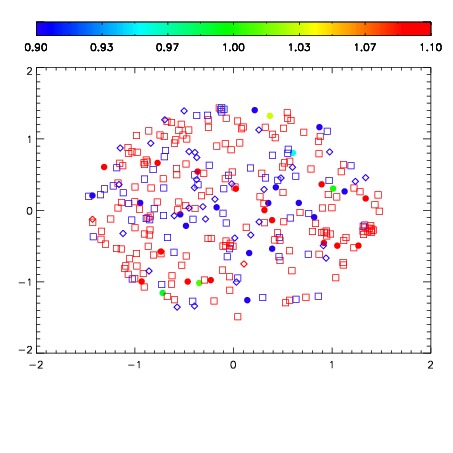


| Frame | Nreads | Zeropoints | Mag plots | Spatial mag deviation | Spatial sky 16325A emission deviations (filled: sky, open: star) | Spatial sky continuum emission | Spatial sky telluric CO2 absorption deviations (filled: H < 10) | |||||||||||||||||||||||
| 0 | 0 |
|
|
|
|
|
|
| IPAIR | NAME | SHIFT | NEWSHIFT | S/N | NAME | SHIFT | NEWSHIFT | S/N |
| 0 | 13730027 | 0.504106 | 0.00000 | 19.1791 | 13730029 | -0.000497231 | 0.504603 | 19.1938 |
| 1 | 13730031 | 0.501980 | 0.00212598 | 19.1861 | 13730028 | 7.92598e-05 | 0.504027 | 19.1973 |
| 2 | 13730030 | 0.501115 | 0.00299096 | 19.1787 | 13730032 | 0.00128140 | 0.502825 | 19.1895 |
| 3 | 13730026 | 0.504096 | 1.00136e-05 | 19.1653 | 13730025 | 0.00000 | 0.504106 | 19.1772 |