| Red | Green | Blue | |
| z | 17.64 | ||
| znorm | Inf | ||
| sky | -NaN | -NaN | -NaN |
| S/N | 27.6 | 46.2 | 51.7 |
| S/N(c) | 0.0 | 0.0 | 0.0 |
| SN(E/C) |
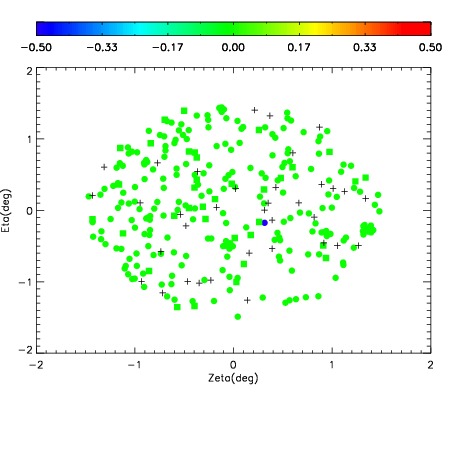
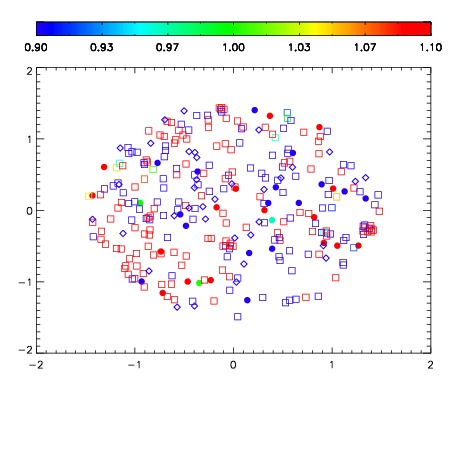
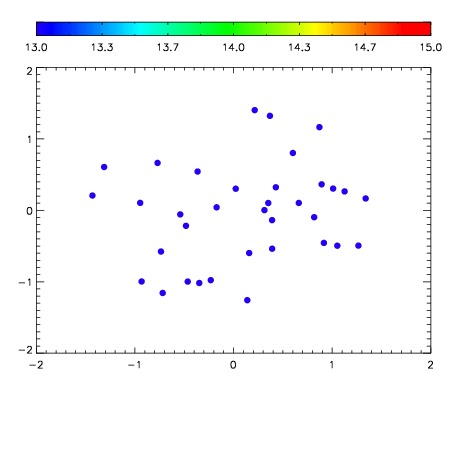

| Frame | Nreads | Zeropoints | Mag plots | Spatial mag deviation | Spatial sky 16325A emission deviations (filled: sky, open: star) | Spatial sky continuum emission | Spatial sky telluric CO2 absorption deviations (filled: H < 10) | |||||||||||||||||||||||
| 0 | 0 |
|
|
|
|
|
|
| IPAIR | NAME | SHIFT | NEWSHIFT | S/N | NAME | SHIFT | NEWSHIFT | S/N |
| 0 | 17300017 | 0.501376 | 0.00000 | 19.1201 | 17300014 | 0.00320424 | 0.498172 | 19.1340 |
| 1 | 17300016 | 0.500550 | 0.000826001 | 19.1101 | 17300011 | 0.00000 | 0.501376 | 19.1222 |
| 2 | 17300012 | 0.498981 | 0.00239497 | 19.1101 | 17300015 | 0.00331309 | 0.498063 | 19.1085 |
| 3 | 17300013 | 0.499673 | 0.00170296 | 19.1059 | 17300018 | 0.00343821 | 0.497938 | 19.0926 |