| Red | Green | Blue | |
| z | 17.64 | ||
| znorm | Inf | ||
| sky | -Inf | -Inf | -Inf |
| S/N | 27.9 | 44.8 | 45.8 |
| S/N(c) | 0.0 | 0.0 | 0.0 |
| SN(E/C) |
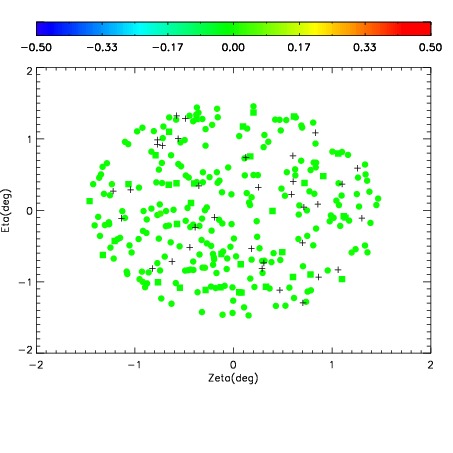
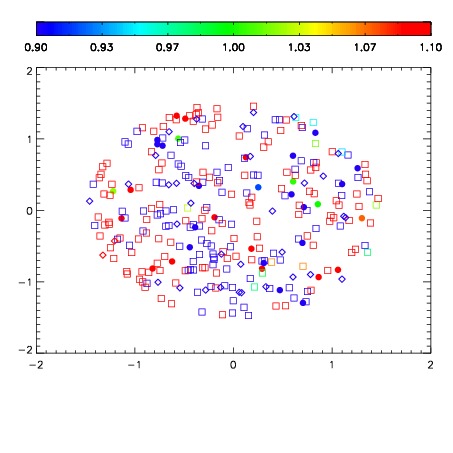


| Frame | Nreads | Zeropoints | Mag plots | Spatial mag deviation | Spatial sky 16325A emission deviations (filled: sky, open: star) | Spatial sky continuum emission | Spatial sky telluric CO2 absorption deviations (filled: H < 10) | |||||||||||||||||||||||
| 0 | 0 |
|
|
|
|
|
|
| IPAIR | NAME | SHIFT | NEWSHIFT | S/N | NAME | SHIFT | NEWSHIFT | S/N |
| 0 | 13750011 | 0.505673 | 0.00000 | 19.1285 | 13750010 | 0.00000 | 0.505673 | 19.0905 |
| 1 | 13750012 | 0.505643 | 2.99811e-05 | 19.1186 | 13750013 | -0.00113539 | 0.506808 | 19.0316 |
| 2 | 13750016 | 0.504937 | 0.000735998 | 18.9751 | 13750014 | -0.000860804 | 0.506534 | 18.9383 |
| 3 | 13750015 | 0.504044 | 0.00162899 | 18.9474 | 13750017 | 0.000708386 | 0.504965 | 18.7437 |