| Red | Green | Blue | |
| z | 17.64 | ||
| znorm | Inf | ||
| sky | -Inf | -NaN | -Inf |
| S/N | 28.0 | 46.1 | 46.7 |
| S/N(c) | 0.0 | 0.0 | 0.0 |
| SN(E/C) |
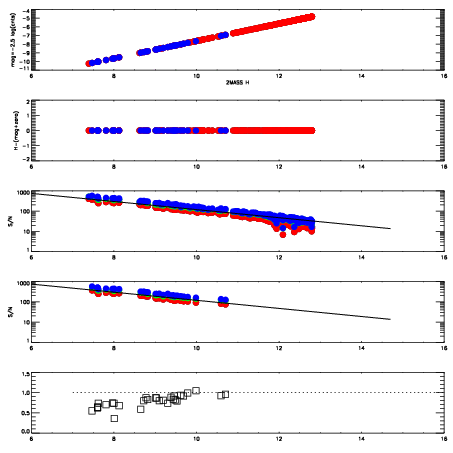

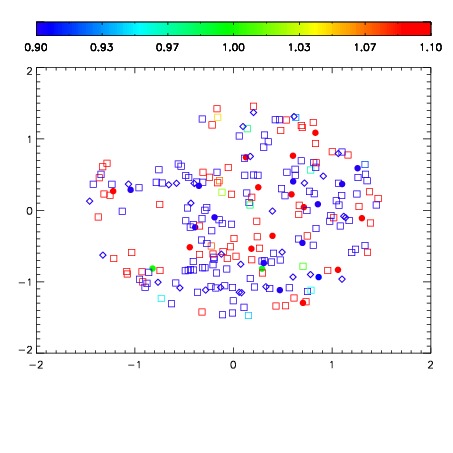
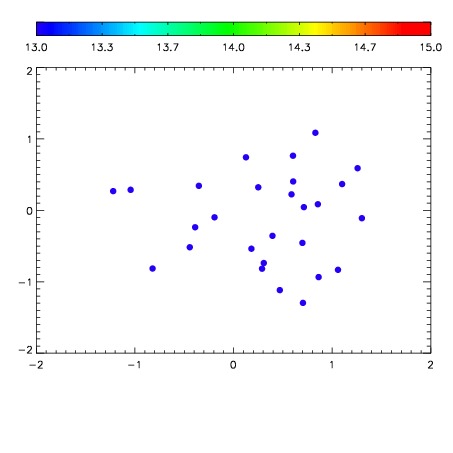

| Frame | Nreads | Zeropoints | Mag plots | Spatial mag deviation | Spatial sky 16325A emission deviations (filled: sky, open: star) | Spatial sky continuum emission | Spatial sky telluric CO2 absorption deviations (filled: H < 10) | |||||||||||||||||||||||
| 0 | 0 |
|
|
|
|
|
|
| IPAIR | NAME | SHIFT | NEWSHIFT | S/N | NAME | SHIFT | NEWSHIFT | S/N |
| 0 | 16430050 | 0.488629 | 0.00000 | 19.0603 | 16430051 | 0.000934345 | 0.487695 | 19.0561 |
| 1 | 16430049 | 0.487613 | 0.00101602 | 19.0469 | 16430047 | 0.000379634 | 0.488249 | 19.0176 |
| 2 | 16430045 | 0.486309 | 0.00232002 | 18.9924 | 16430044 | 0.00000 | 0.488629 | 19.0163 |
| 3 | 16430046 | 0.487462 | 0.00116700 | 18.9601 | 16430048 | -0.000541022 | 0.489170 | 19.0025 |