| Red | Green | Blue | |
| z | 17.64 | ||
| znorm | Inf | ||
| sky | -Inf | -NaN | -NaN |
| S/N | 28.2 | 45.6 | 50.1 |
| S/N(c) | 0.0 | 0.0 | 0.0 |
| SN(E/C) |
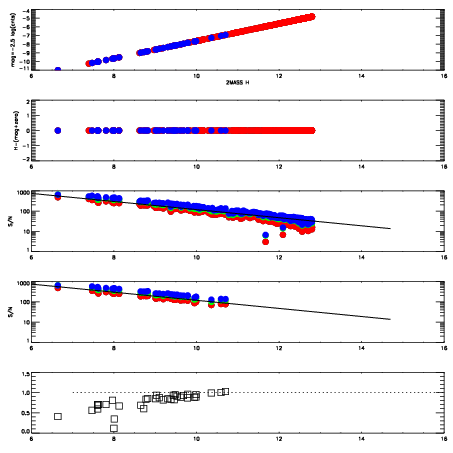


| Frame | Nreads | Zeropoints | Mag plots | Spatial mag deviation | Spatial sky 16325A emission deviations (filled: sky, open: star) | Spatial sky continuum emission | Spatial sky telluric CO2 absorption deviations (filled: H < 10) | |||||||||||||||||||||||
| 0 | 0 |
|
|
|
|
|
|
| IPAIR | NAME | SHIFT | NEWSHIFT | S/N | NAME | SHIFT | NEWSHIFT | S/N |
| 0 | 17040016 | 0.489323 | 0.00000 | 19.0028 | 17040017 | 0.00355156 | 0.485771 | 18.9441 |
| 1 | 17040015 | 0.488907 | 0.000415981 | 19.1384 | 17040013 | 0.000801609 | 0.488521 | 19.1323 |
| 2 | 17040012 | 0.488012 | 0.00131100 | 19.0176 | 17040014 | 0.00103328 | 0.488290 | 19.1208 |
| 3 | 17040011 | 0.488070 | 0.00125298 | 19.0174 | 17040010 | 0.00000 | 0.489323 | 19.0518 |