| Red | Green | Blue | |
| z | 17.64 | ||
| znorm | Inf | ||
| sky | -Inf | -Inf | -NaN |
| S/N | 37.1 | 56.6 | 58.8 |
| S/N(c) | 0.0 | 0.0 | 0.0 |
| SN(E/C) |
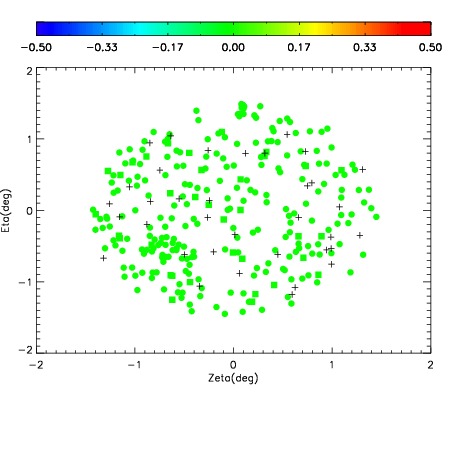
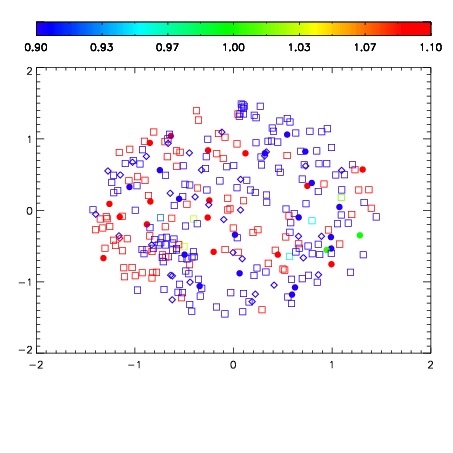


| Frame | Nreads | Zeropoints | Mag plots | Spatial mag deviation | Spatial sky 16325A emission deviations (filled: sky, open: star) | Spatial sky continuum emission | Spatial sky telluric CO2 absorption deviations (filled: H < 10) | |||||||||||||||||||||||
| 0 | 0 |
|
|
|
|
|
|
| IPAIR | NAME | SHIFT | NEWSHIFT | S/N | NAME | SHIFT | NEWSHIFT | S/N |
| 0 | 17350028 | 0.506028 | 0.00000 | 19.2141 | 17350029 | 0.00428977 | 0.501738 | 19.2183 |
| 1 | 17350031 | 0.501970 | 0.00405800 | 19.1982 | 17350026 | 0.00314858 | 0.502879 | 19.2138 |
| 2 | 17350027 | 0.504691 | 0.00133699 | 19.1947 | 17350030 | 0.00455035 | 0.501478 | 19.2023 |
| 3 | 17350023 | 0.503361 | 0.00266701 | 19.1659 | 17350025 | 0.00279926 | 0.503229 | 19.2017 |
| 4 | 17350024 | 0.503804 | 0.00222397 | 19.1569 | 17350022 | 0.00000 | 0.506028 | 19.1930 |