| Red | Green | Blue | |
| z | 17.64 | ||
| znorm | Inf | ||
| sky | -Inf | -NaN | -Inf |
| S/N | 20.6 | 33.6 | 39.6 |
| S/N(c) | 0.0 | 0.0 | 0.0 |
| SN(E/C) |
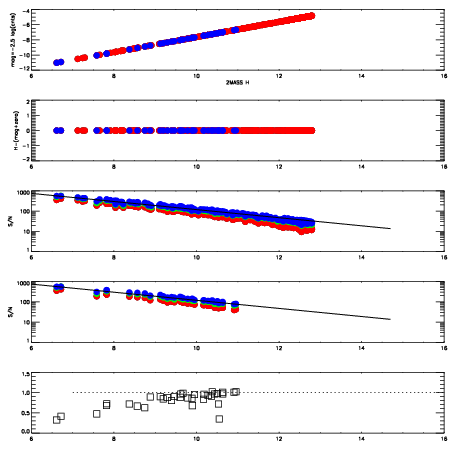
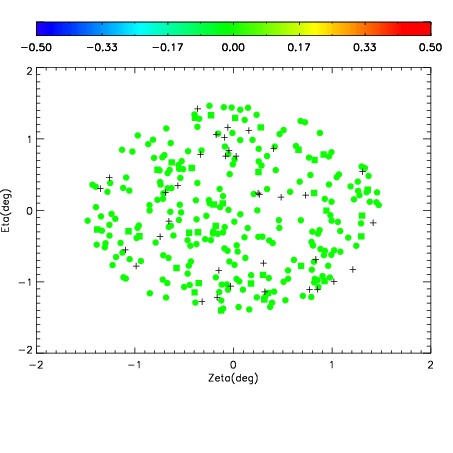
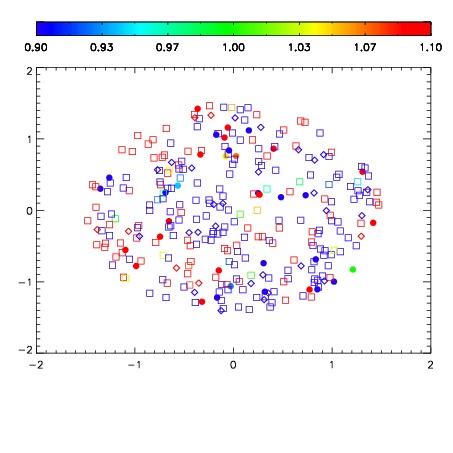
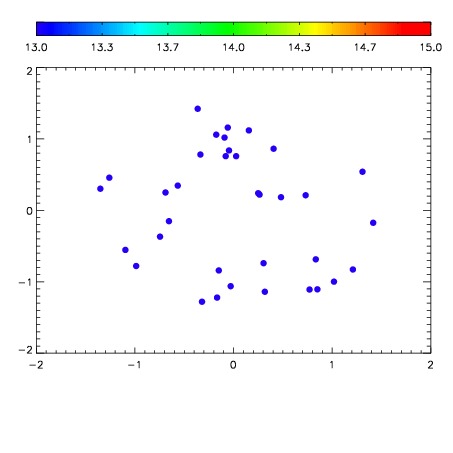

| Frame | Nreads | Zeropoints | Mag plots | Spatial mag deviation | Spatial sky 16325A emission deviations (filled: sky, open: star) | Spatial sky continuum emission | Spatial sky telluric CO2 absorption deviations (filled: H < 10) | |||||||||||||||||||||||
| 0 | 0 |
|
|
|
|
|
|
| IPAIR | NAME | SHIFT | NEWSHIFT | S/N | NAME | SHIFT | NEWSHIFT | S/N |
| 0 | 13490014 | 0.499923 | 0.00000 | 19.0549 | 13490013 | 0.00000 | 0.499923 | 19.0768 |
| 1 | 13490015 | 0.499615 | 0.000307977 | 19.0484 | 13490016 | -0.000887725 | 0.500811 | 18.9853 |
| 2 | 13490019 | 0.498334 | 0.00158900 | 17.8251 | 13490017 | -0.000521759 | 0.500445 | 18.6964 |
| 3 | 13490018 | 0.499046 | 0.000876993 | 17.1830 | 13490020 | -0.00295946 | 0.502882 | 18.0701 |