| Red | Green | Blue | |
| z | 17.64 | ||
| znorm | Inf | ||
| sky | -NaN | -NaN | -NaN |
| S/N | 24.8 | 43.7 | 48.1 |
| S/N(c) | 0.0 | 0.0 | 0.0 |
| SN(E/C) |
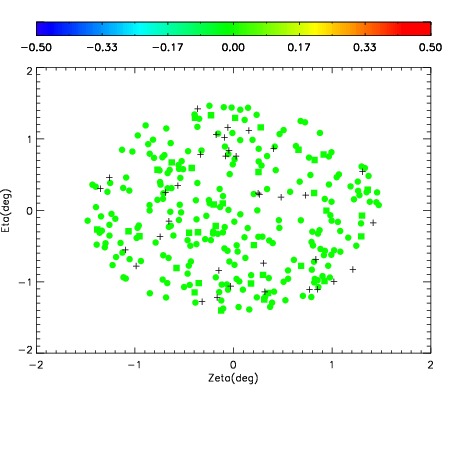
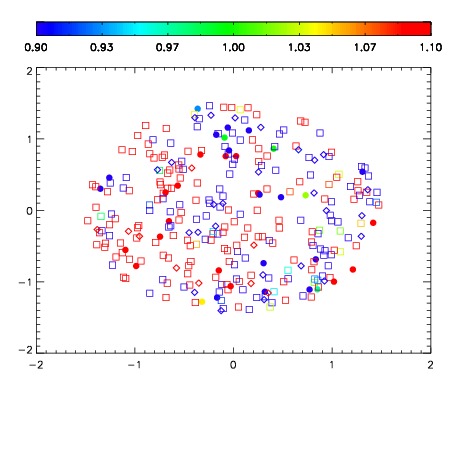
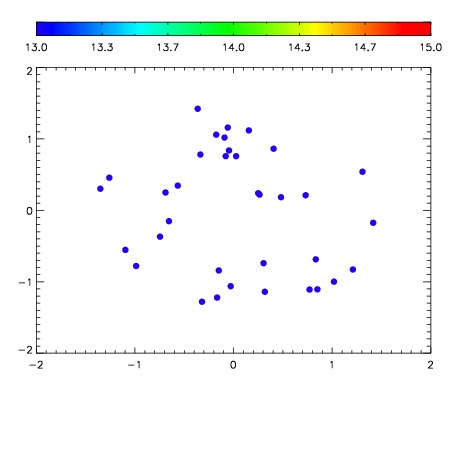

| Frame | Nreads | Zeropoints | Mag plots | Spatial mag deviation | Spatial sky 16325A emission deviations (filled: sky, open: star) | Spatial sky continuum emission | Spatial sky telluric CO2 absorption deviations (filled: H < 10) | |||||||||||||||||||||||
| 0 | 0 |
|
|
|
|
|
|
| IPAIR | NAME | SHIFT | NEWSHIFT | S/N | NAME | SHIFT | NEWSHIFT | S/N |
| 0 | 13730037 | 0.502137 | 0.00000 | 19.1786 | 13730036 | 0.00000 | 0.502137 | 19.1982 |
| 1 | 13730038 | 0.501761 | 0.000375986 | 19.2037 | 13730039 | -0.000553856 | 0.502691 | 19.1989 |
| 2 | 13730041 | 0.501043 | 0.00109398 | 19.1467 | 13730040 | -2.38430e-05 | 0.502161 | 19.1770 |
| 3 | 13730042 | 0.501667 | 0.000469983 | 19.1133 | 13730043 | -0.000731583 | 0.502869 | 19.1668 |