| Red | Green | Blue | |
| z | 17.64 | ||
| znorm | Inf | ||
| sky | -NaN | -Inf | -NaN |
| S/N | 11.7 | 20.8 | 23.9 |
| S/N(c) | 0.0 | 0.0 | 0.0 |
| SN(E/C) |
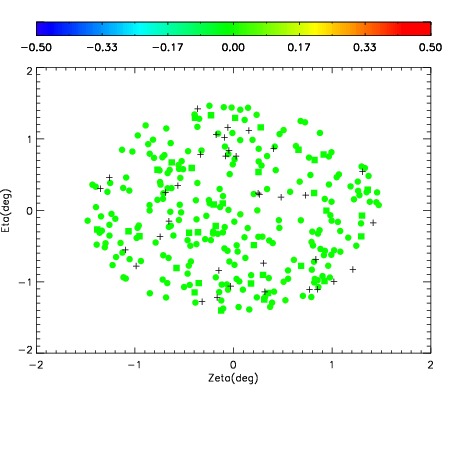
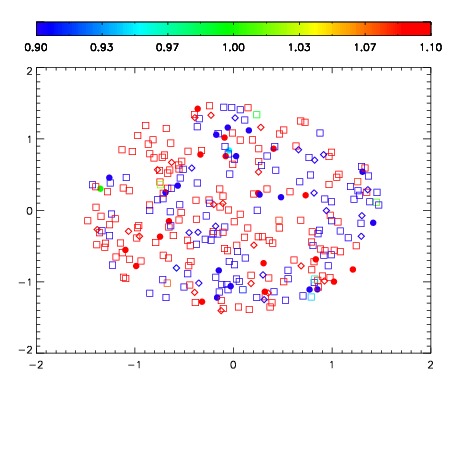
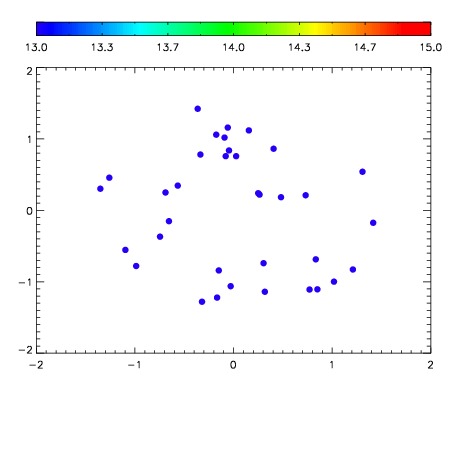

| Frame | Nreads | Zeropoints | Mag plots | Spatial mag deviation | Spatial sky 16325A emission deviations (filled: sky, open: star) | Spatial sky continuum emission | Spatial sky telluric CO2 absorption deviations (filled: H < 10) | |||||||||||||||||||||||
| 0 | 0 |
|
|
|
|
|
|
| IPAIR | NAME | SHIFT | NEWSHIFT | S/N | NAME | SHIFT | NEWSHIFT | S/N |
| 0 | 13760035 | 0.508216 | 0.00000 | 16.5848 | 13760033 | 0.00000 | 0.508216 | 17.5417 |
| 1 | 13760039 | 0.507093 | 0.00112301 | 18.6486 | 13760040 | 0.00142614 | 0.506790 | 18.3263 |
| 2 | 13760038 | 0.506875 | 0.00134104 | 18.3813 | 13760037 | 0.000506435 | 0.507710 | 18.2490 |
| 3 | 13760034 | 0.507905 | 0.000311017 | 17.4508 | 13760036 | 0.00137620 | 0.506840 | 17.6892 |