| Red | Green | Blue | |
| z | 17.64 | ||
| znorm | Inf | ||
| sky | -Inf | -Inf | -Inf |
| S/N | 24.6 | 43.4 | 46.5 |
| S/N(c) | 0.0 | 0.0 | 0.0 |
| SN(E/C) |
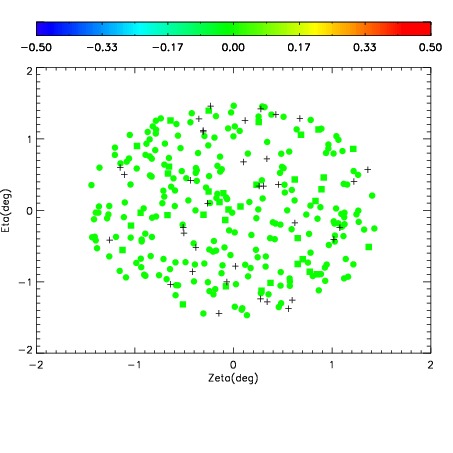
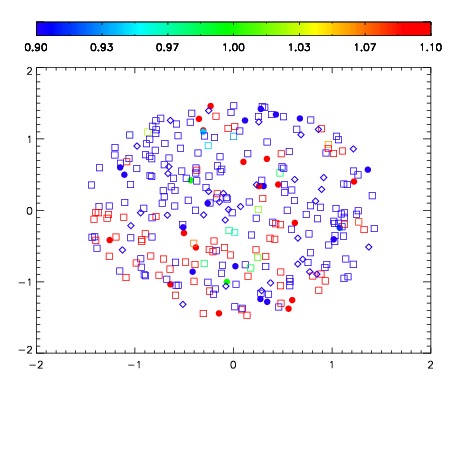
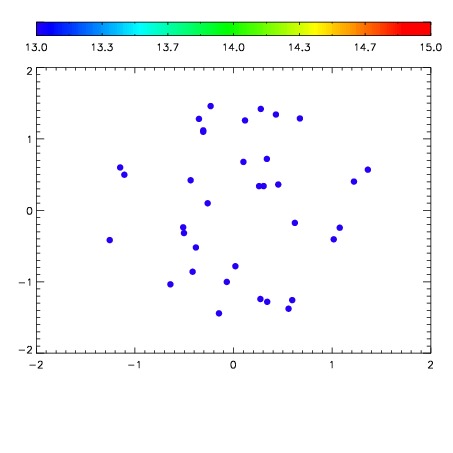

| Frame | Nreads | Zeropoints | Mag plots | Spatial mag deviation | Spatial sky 16325A emission deviations (filled: sky, open: star) | Spatial sky continuum emission | Spatial sky telluric CO2 absorption deviations (filled: H < 10) | |||||||||||||||||||||||
| 0 | 0 |
|
|
|
|
|
|
| IPAIR | NAME | SHIFT | NEWSHIFT | S/N | NAME | SHIFT | NEWSHIFT | S/N |
| 0 | 17020056 | 0.485540 | 0.00000 | 18.9803 | 17020057 | 0.000138426 | 0.485402 | 18.9730 |
| 1 | 17020055 | 0.485300 | 0.000239998 | 18.8612 | 17020058 | -0.000247017 | 0.485787 | 18.8544 |
| 2 | 17020060 | 0.482823 | 0.00271699 | 18.8458 | 17020061 | -0.000686950 | 0.486227 | 18.8535 |
| 3 | 17020059 | 0.483373 | 0.00216702 | 18.8437 | 17020054 | 0.00000 | 0.485540 | 18.8429 |