| Red | Green | Blue | |
| z | 17.64 | ||
| znorm | Inf | ||
| sky | -NaN | -Inf | -Inf |
| S/N | 7.5 | 14.9 | 15.6 |
| S/N(c) | 0.0 | 0.0 | 0.0 |
| SN(E/C) |
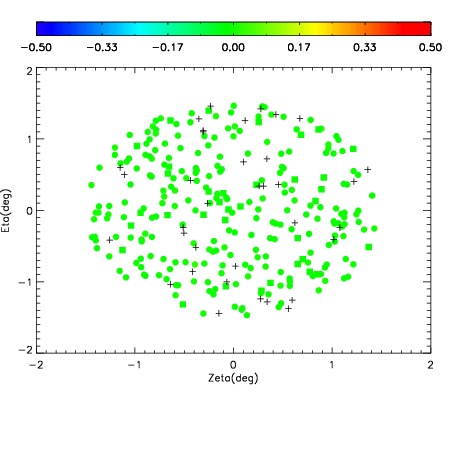
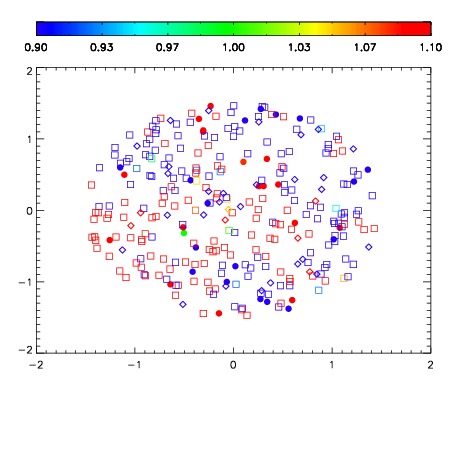
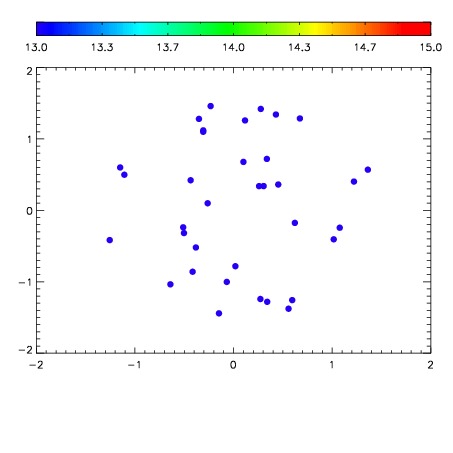

| Frame | Nreads | Zeropoints | Mag plots | Spatial mag deviation | Spatial sky 16325A emission deviations (filled: sky, open: star) | Spatial sky continuum emission | Spatial sky telluric CO2 absorption deviations (filled: H < 10) | |||||||||||||||||||||||
| 0 | 0 |
|
|
|
|
|
|
| IPAIR | NAME | SHIFT | NEWSHIFT | S/N | NAME | SHIFT | NEWSHIFT | S/N |
| 0 | 17050053 | 0.484102 | 0.00000 | 17.1084 | 17050052 | 0.000522479 | 0.483580 | 17.1780 |
| 1 | 17050066 | 0.478635 | 0.00546700 | 17.4799 | 17050048 | 0.00000 | 0.484102 | 17.7238 |
| 2 | 17050065 | 0.478113 | 0.00598902 | 17.0591 | 17050064 | -0.00670187 | 0.490804 | 17.0508 |
| 3 | 17050049 | 0.482890 | 0.00121200 | 17.0412 | 17050067 | -0.00673766 | 0.490840 | 16.9707 |
| 4 | 17050050 | 0.483491 | 0.000611007 | 16.8647 | 17050059 | -0.00578508 | 0.489887 | 16.8468 |
| 5 | 17050054 | 0.483092 | 0.00101000 | 16.8465 | 17050051 | -0.000249859 | 0.484352 | 16.8346 |
| 6 | 17050058 | 0.482574 | 0.00152802 | 16.6334 | 17050063 | -0.00626436 | 0.490366 | 16.7342 |
| 7 | 17050057 | 0.482045 | 0.00205702 | 15.9495 | 17050055 | -0.00494640 | 0.489048 | 16.6108 |
| 8 | 17050061 | 0.479568 | 0.00453401 | 15.8559 | 17050060 | -0.00623745 | 0.490339 | 16.5768 |
| 9 | 17050062 | 0.479112 | 0.00499001 | 14.9573 | 17050056 | -0.00544912 | 0.489551 | 16.1035 |