| Red | Green | Blue | |
| z | 17.64 | ||
| znorm | Inf | ||
| sky | -NaN | -NaN | -NaN |
| S/N | 20.5 | 37.8 | 40.5 |
| S/N(c) | 0.0 | 0.0 | 0.0 |
| SN(E/C) |
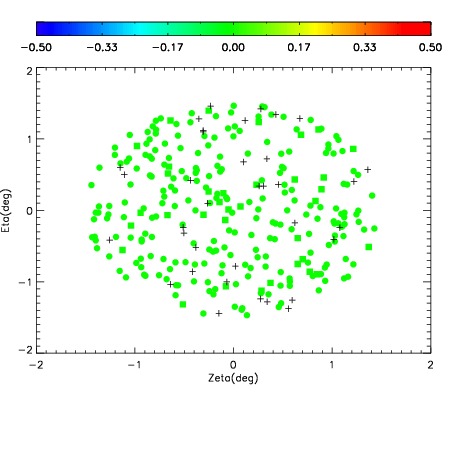
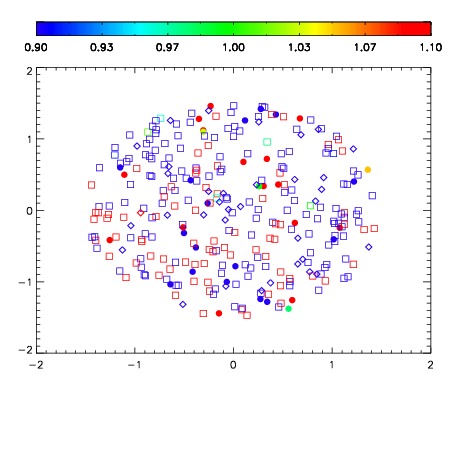


| Frame | Nreads | Zeropoints | Mag plots | Spatial mag deviation | Spatial sky 16325A emission deviations (filled: sky, open: star) | Spatial sky continuum emission | Spatial sky telluric CO2 absorption deviations (filled: H < 10) | |||||||||||||||||||||||
| 0 | 0 |
|
|
|
|
|
|
| IPAIR | NAME | SHIFT | NEWSHIFT | S/N | NAME | SHIFT | NEWSHIFT | S/N |
| 0 | 17070038 | 0.489414 | 0.00000 | 18.6668 | 17070036 | 0.00000 | 0.489414 | 18.5375 |
| 1 | 17070041 | 0.487985 | 0.00142902 | 19.0587 | 17070040 | 0.00150618 | 0.487908 | 19.0282 |
| 2 | 17070042 | 0.488132 | 0.00128201 | 18.7321 | 17070039 | 0.00122838 | 0.488186 | 18.7102 |
| 3 | 17070037 | 0.489049 | 0.000365019 | 18.6178 | 17070043 | 0.00265851 | 0.486755 | 18.4249 |