| Red | Green | Blue | |
| z | 17.64 | ||
| znorm | Inf | ||
| sky | -NaN | -NaN | -NaN |
| S/N | 32.6 | 51.9 | 60.0 |
| S/N(c) | 0.0 | 0.0 | 0.0 |
| SN(E/C) |
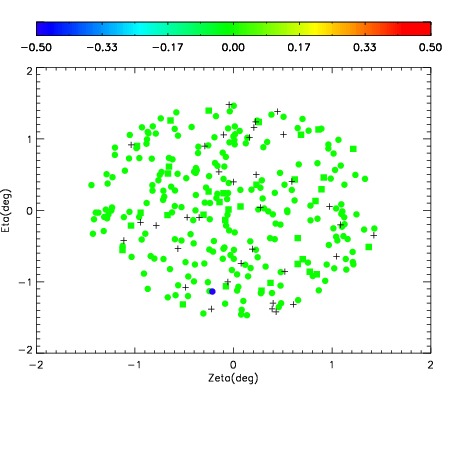
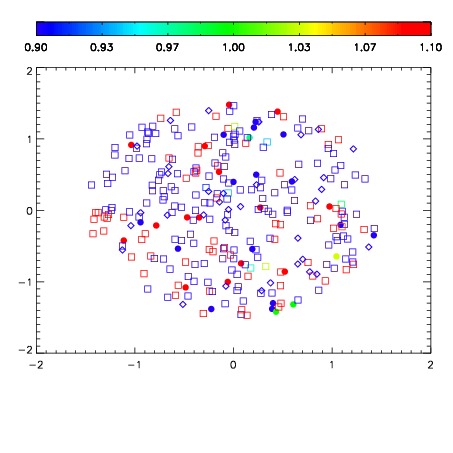
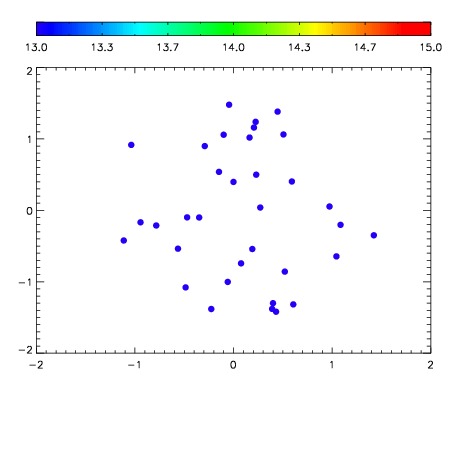

| Frame | Nreads | Zeropoints | Mag plots | Spatial mag deviation | Spatial sky 16325A emission deviations (filled: sky, open: star) | Spatial sky continuum emission | Spatial sky telluric CO2 absorption deviations (filled: H < 10) | |||||||||||||||||||||||
| 0 | 0 |
|
|
|
|
|
|
| IPAIR | NAME | SHIFT | NEWSHIFT | S/N | NAME | SHIFT | NEWSHIFT | S/N |
| 0 | 17000013 | 0.488111 | 0.00000 | 19.2285 | 17000014 | 0.000992111 | 0.487119 | 19.2373 |
| 1 | 17000012 | 0.487687 | 0.000423998 | 19.2345 | 17000015 | 0.000886919 | 0.487224 | 19.2373 |
| 2 | 17000016 | 0.487259 | 0.000851989 | 19.2167 | 17000018 | -0.00215169 | 0.490263 | 19.2105 |
| 3 | 17000017 | 0.487099 | 0.00101200 | 19.2102 | 17000011 | 0.00000 | 0.488111 | 19.1976 |