| Red | Green | Blue | |
| z | 17.64 | ||
| znorm | Inf | ||
| sky | -NaN | -Inf | -Inf |
| S/N | 30.7 | 52.3 | 56.7 |
| S/N(c) | 0.0 | 0.0 | 0.0 |
| SN(E/C) |
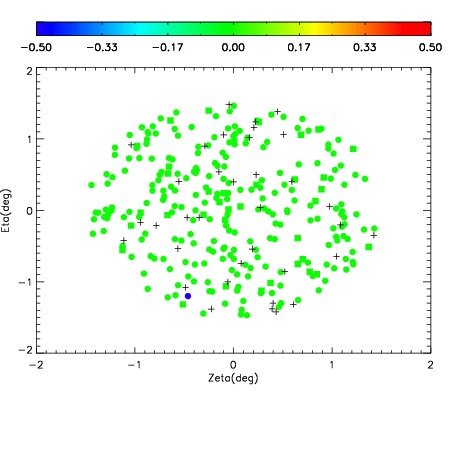
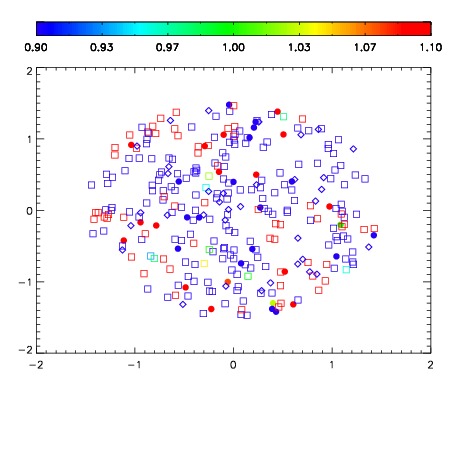


| Frame | Nreads | Zeropoints | Mag plots | Spatial mag deviation | Spatial sky 16325A emission deviations (filled: sky, open: star) | Spatial sky continuum emission | Spatial sky telluric CO2 absorption deviations (filled: H < 10) | |||||||||||||||||||||||
| 0 | 0 |
|
|
|
|
|
|
| IPAIR | NAME | SHIFT | NEWSHIFT | S/N | NAME | SHIFT | NEWSHIFT | S/N |
| 0 | 17030060 | 0.483882 | 0.00000 | 19.1616 | 17030059 | 0.00000 | 0.483882 | 19.1420 |
| 1 | 17030061 | 0.482240 | 0.00164202 | 19.1290 | 17030066 | -0.00446244 | 0.488344 | 19.1343 |
| 2 | 17030064 | 0.481304 | 0.00257802 | 19.1080 | 17030062 | -0.00193872 | 0.485821 | 19.1193 |
| 3 | 17030065 | 0.481218 | 0.00266400 | 19.0607 | 17030063 | -0.00254480 | 0.486427 | 19.1080 |